Hello, aspiring Cyber Forensic Investigators. In our previous blogpost, you learnt in detail about digital forensics. In this article, you will learn about Memory Forensics. When most people think about digital forensics, they imagine hard drives, deleted files and disk images. While disk forensics is still important, many modern attacks leave their most valuable evidence somewhere else entirely—in system memory (RAM). This is where memory forensics comes in.
New to Ethical Hacking?
Start your journey with The Beginner Ethical Hacker Starter Kit (2026 Edition).
Inside the free guide, you’ll learn:.
- Ethical hacking fundamentals
- Beginner cybersecurity roadmap
- Essential hacking tools
- Common vulnerabilities explained
It focuses on analyzing volatile memory to understand what was happening on a system while it was running. For beginners, it can feel intimidating, but the core ideas are easier than they appear to be.
What Is Memory Forensics?
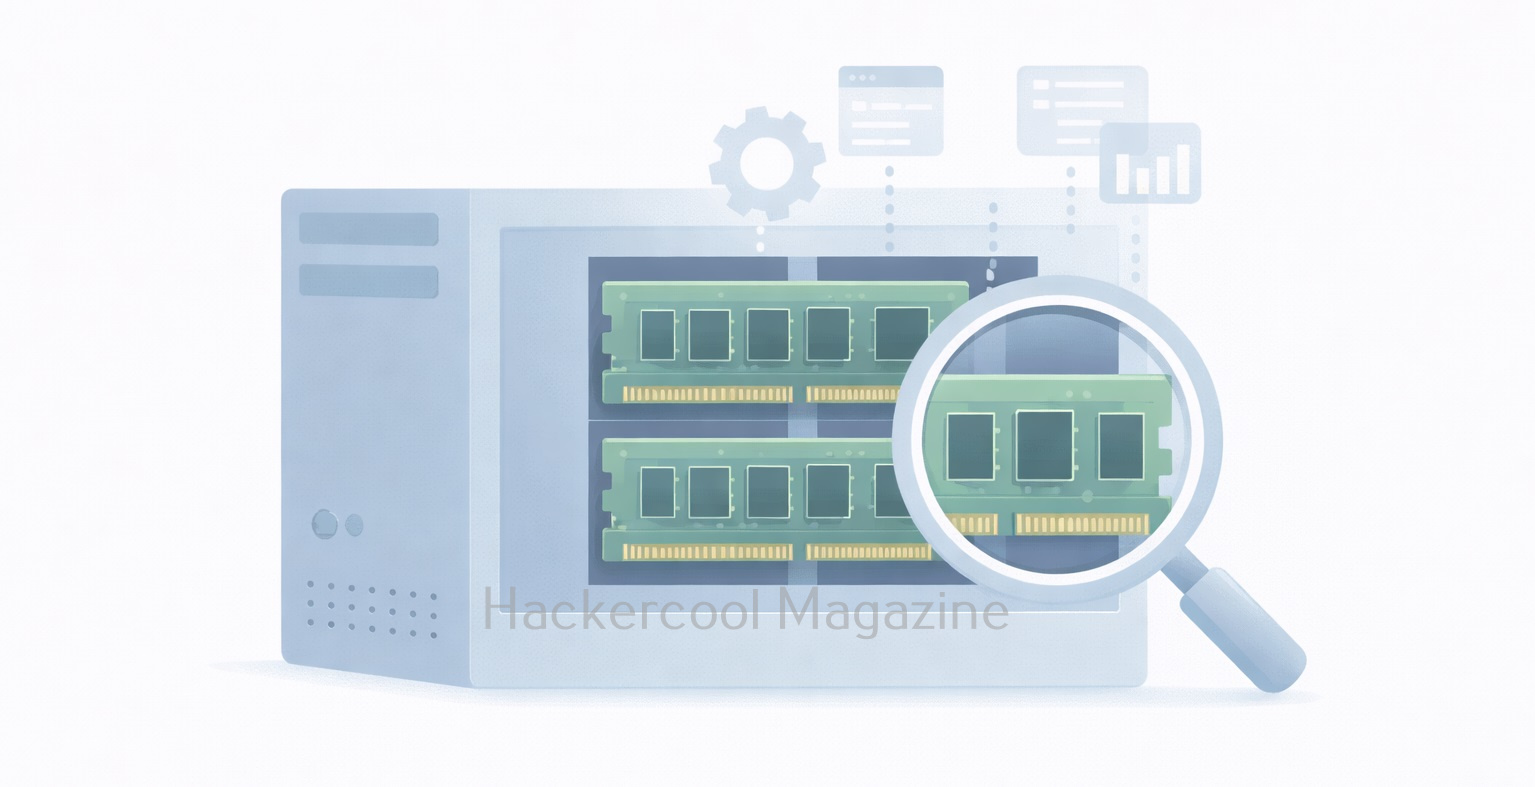
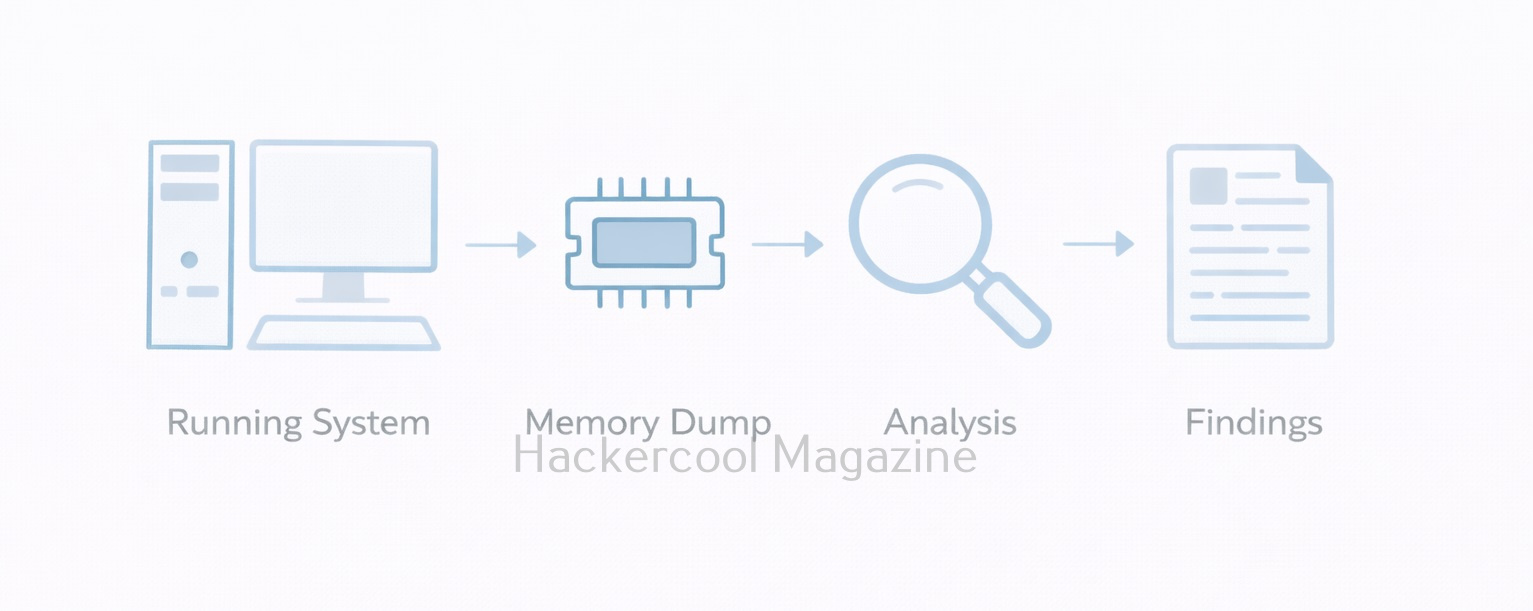
Memory forensics is the process of capturing and analyzing the contents of a system’s RAM to identify malicious activity, suspicious processes or any other unauthorized behavior. RAM contains data that never gets written to disk or only exists briefly, such as running processes, active network connections, encryption keys and injected code.
To put it simply, unlike disk forensics, which looks at what was stored, it looks at what was happening right now or just moments ago.
Why Memory Forensics Is Important?
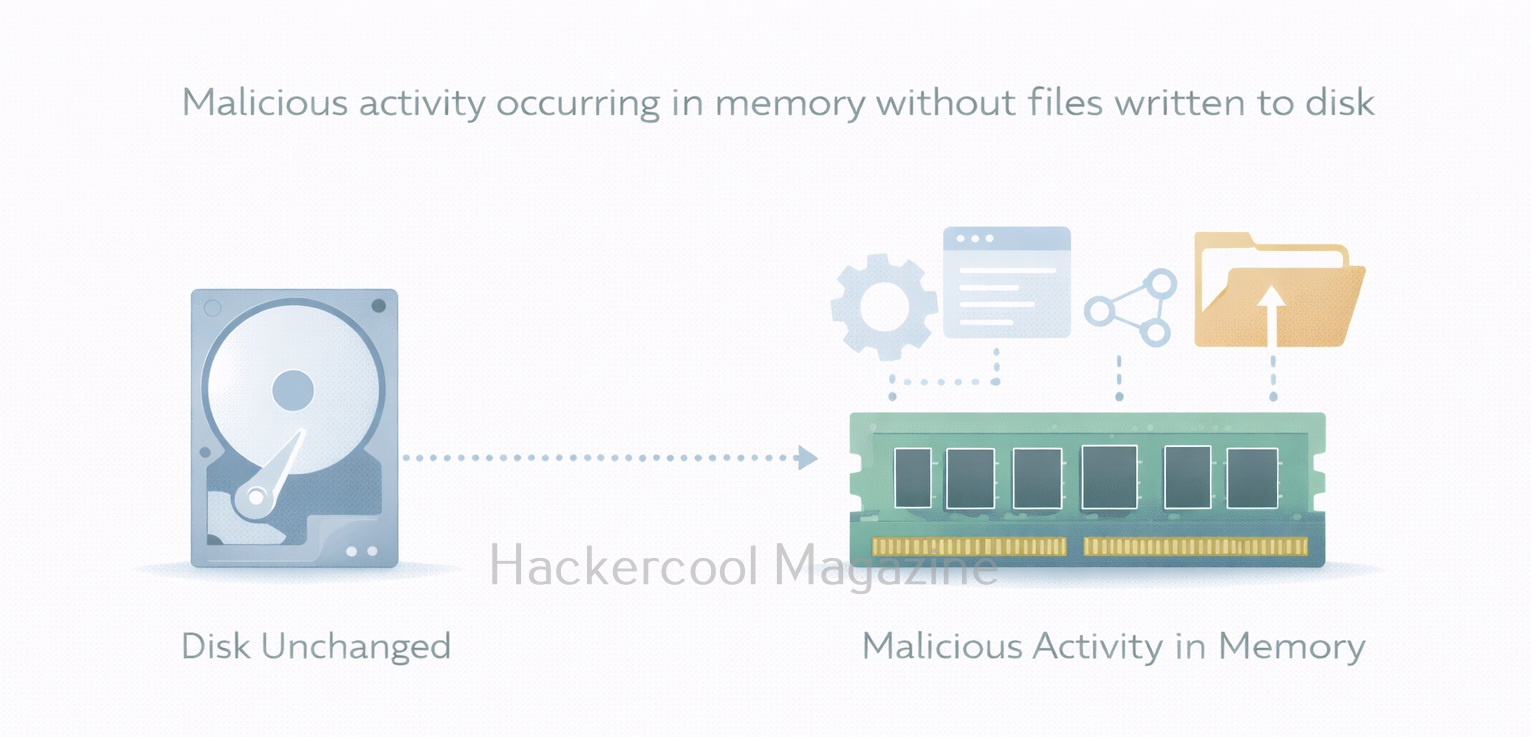
Modern attacks often avoid writing files to disk. Instead, attackers rely on:
- In-memory malware
- Credential theft from running processes
- Fileless attacks using built-in tools
- Living-off-the-land techniques
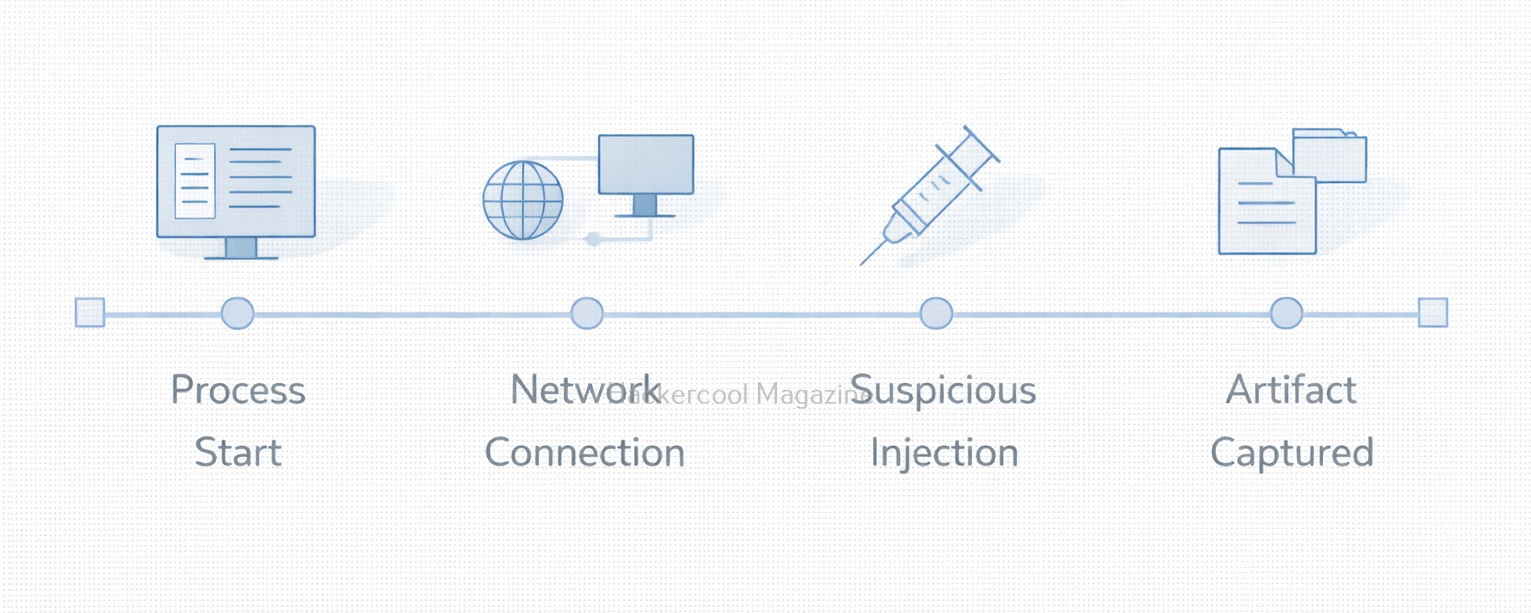
If you only analyze the disk, you may completely miss these activities. Memory analysis helps investigators answer questions like:
- What processes were running?
- Was malicious code was injected into a legitimate process?
- Were there suspicious network connections?
- Were credentials present in memory?
For incident response, memory evidence is often the most time-sensitive and most revealing.
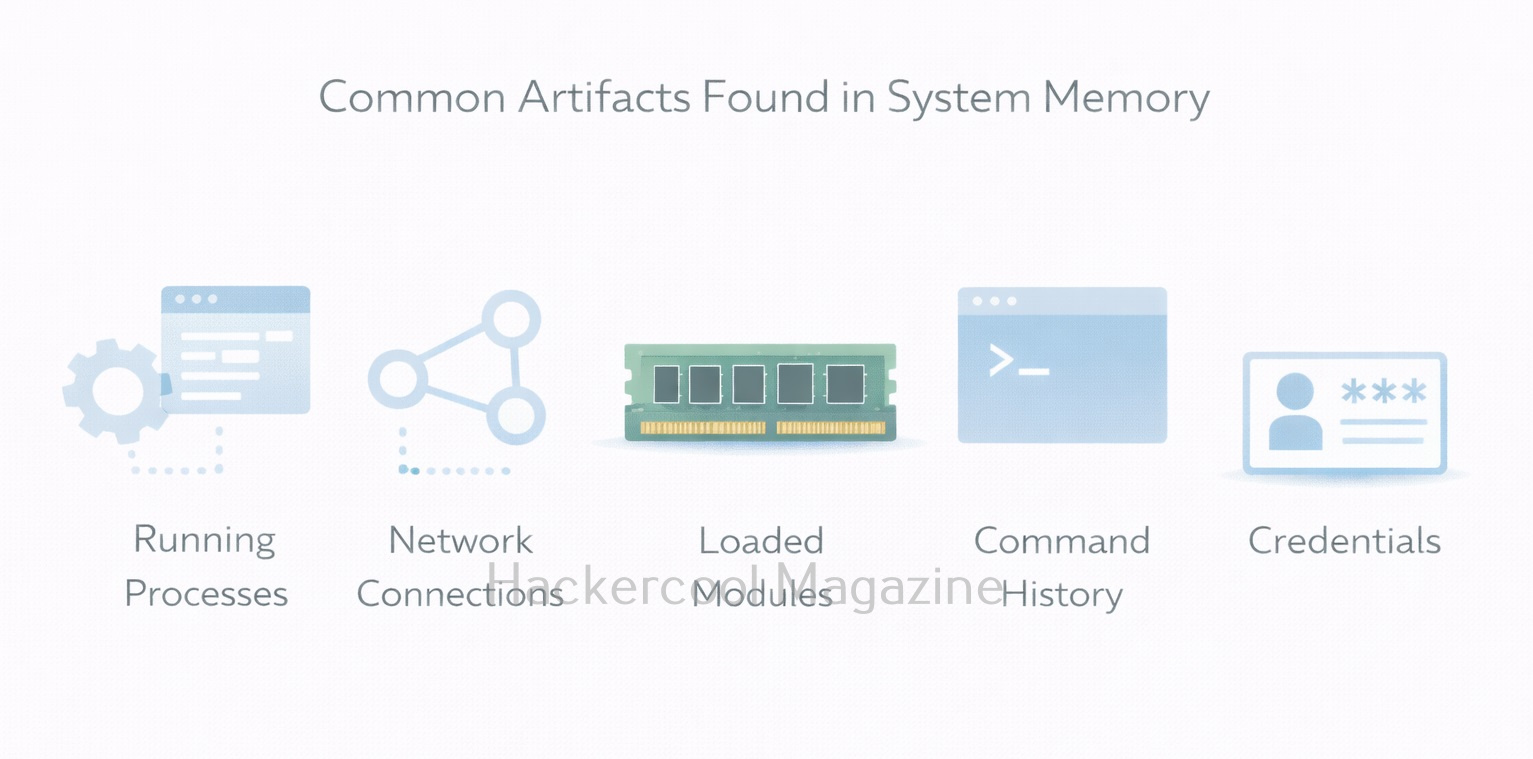
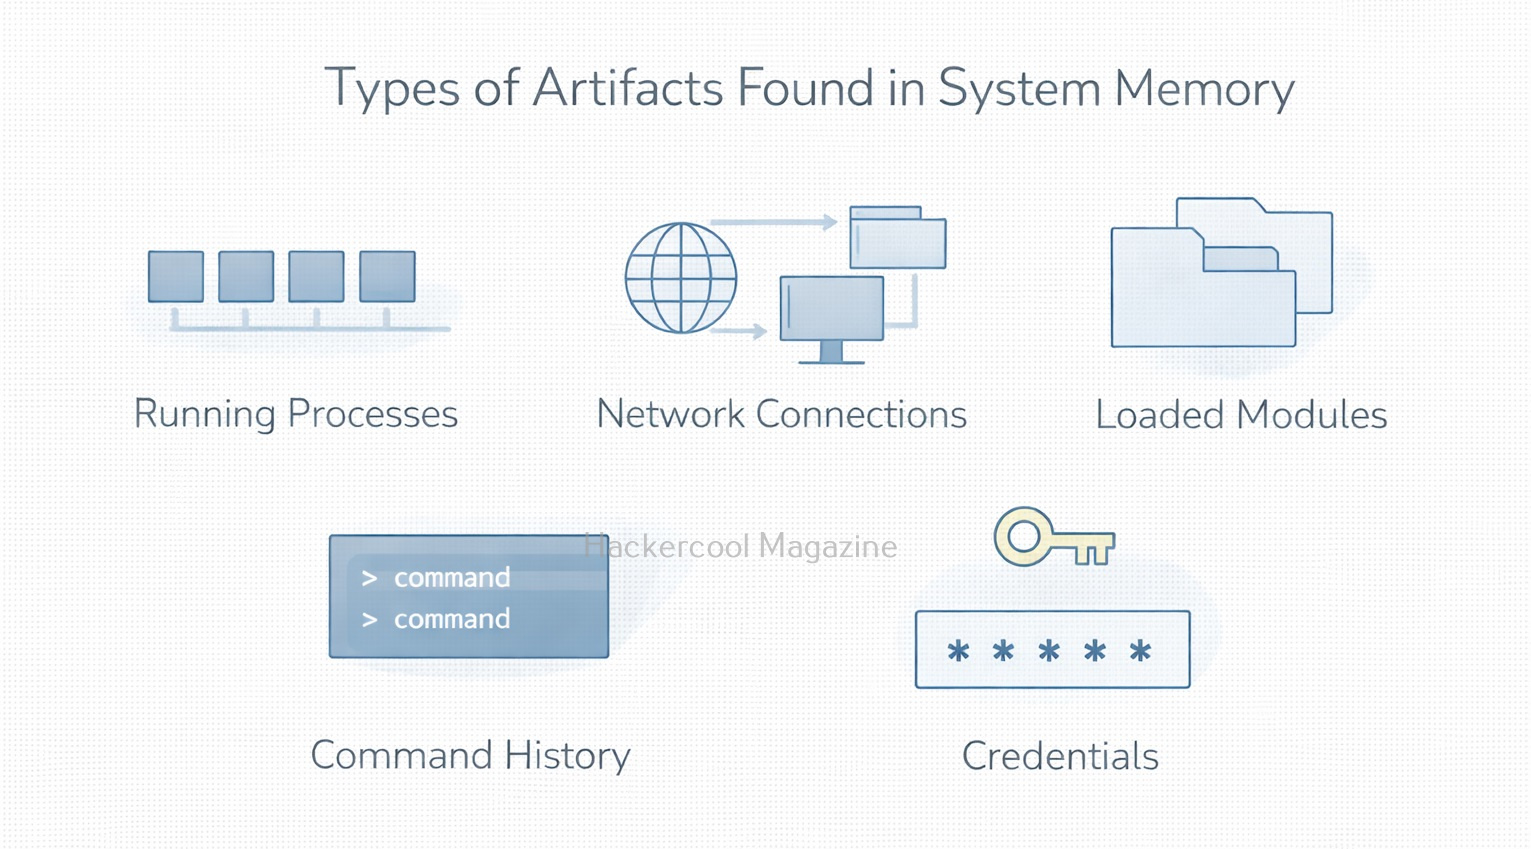
What Kind of Data Lives in RAM?
For beginners, it is very helpful to know what data RAM typically contains. It contains,
- Running processes – active programs and services
- Loaded modules and DLLs – libraries used by processes
- Network connections – open sockets and connections
- Command history – commands executed in shells
- Credentials and tokens – sometimes present in memory
- Injected or hidden code – common in advanced attacks
Not all of this data is always present, but memory analysis helps reveal relationships that disk analysis cannot.
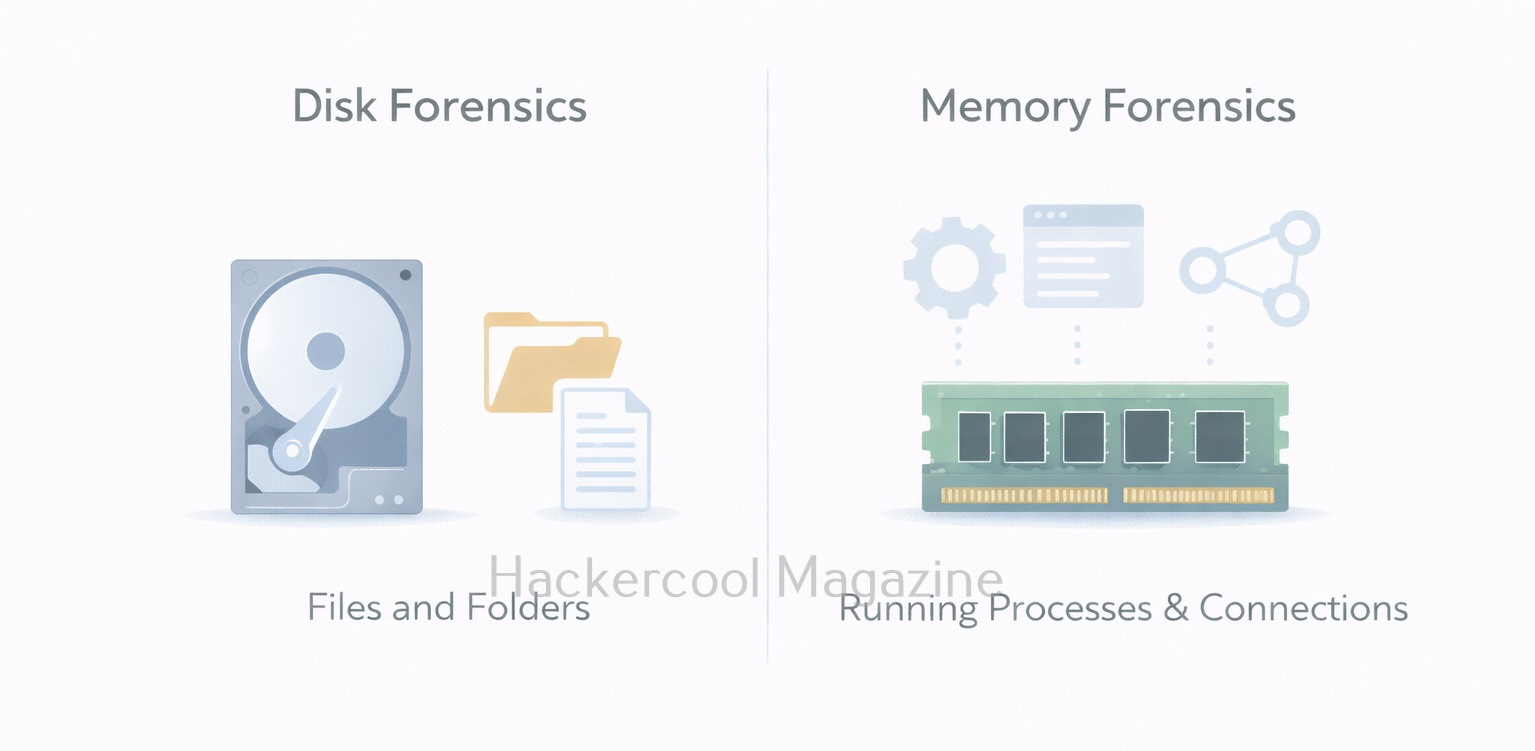
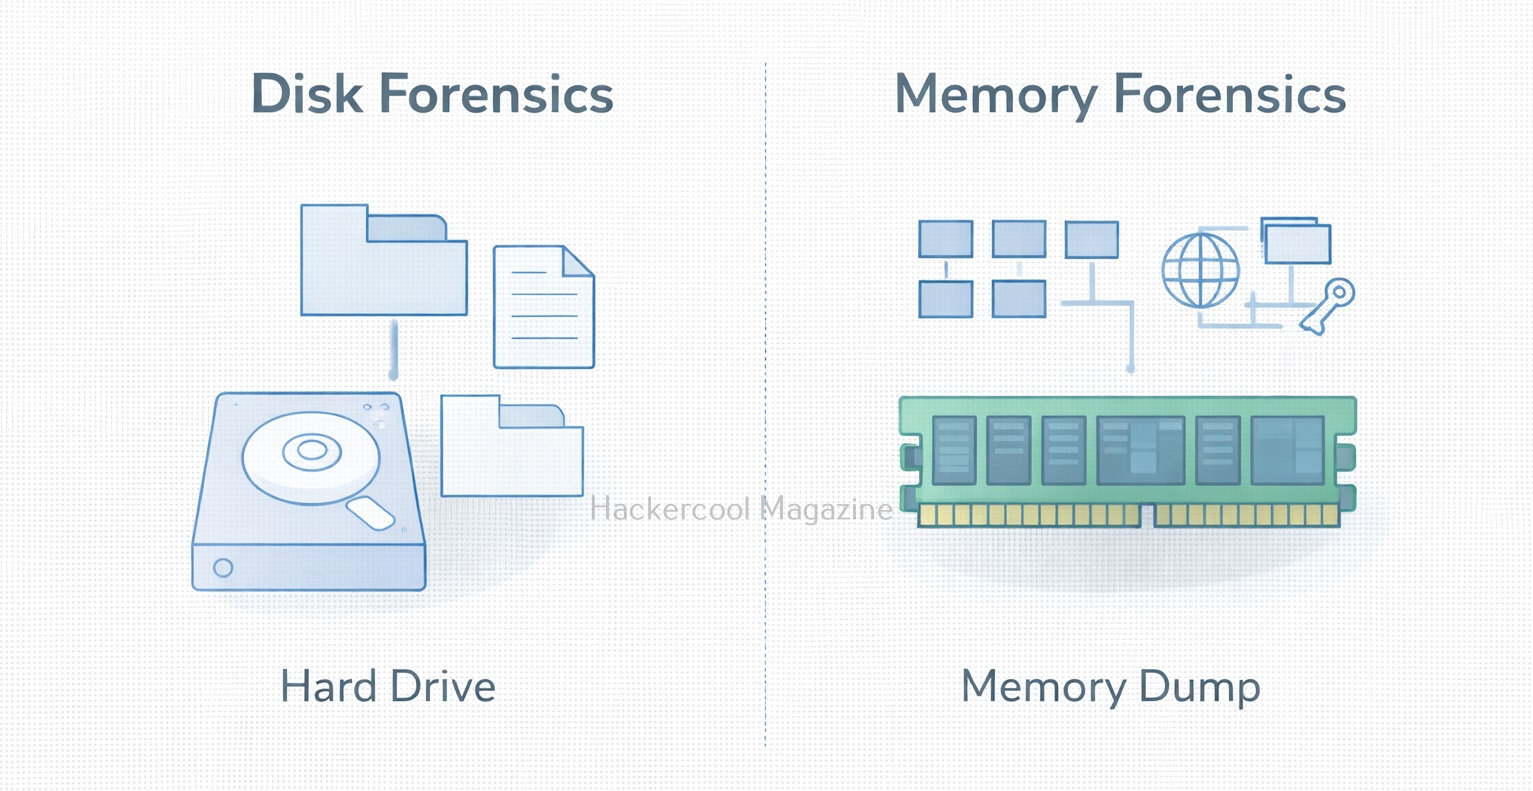
Memory Forensics vs Disk Forensics
Understanding the difference between disk and memory forensics is critical. Here are the differences between them.
Disk Forensics:
Want to Learn Ethical Hacking Step-by-Step?
If you’re serious about learning cybersecurity, a structured roadmap makes the journey much easier.
Download The Beginner Ethical Hacker Starter Kit (2026 Edition) and discover:
✔ The ethical hacking learning path
✔ Beginner-friendly security concepts
✔ Essential tools ethical hackers use
✔ The most common vulnerabilities explained
- Focuses on files and file systems
- Evidence is persistent
- Slower to change
- Good for historical analysis
Memory Forensics:
- Focuses on processes and activity
- Evidence is volatile
- Changes constantly
- Best for live or recent incidents
Both approaches complement each other. Memory forensics rarely replaces disk forensics. It adds context and visibility.
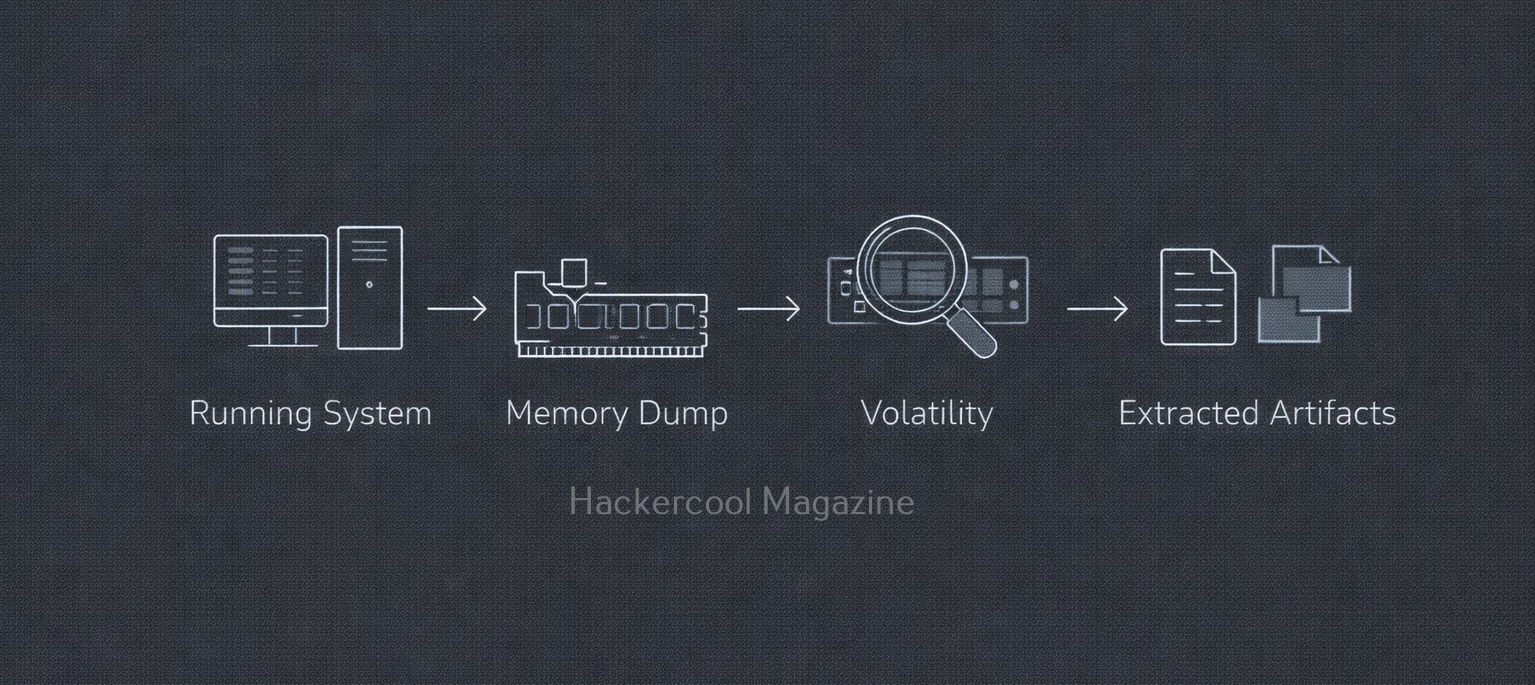
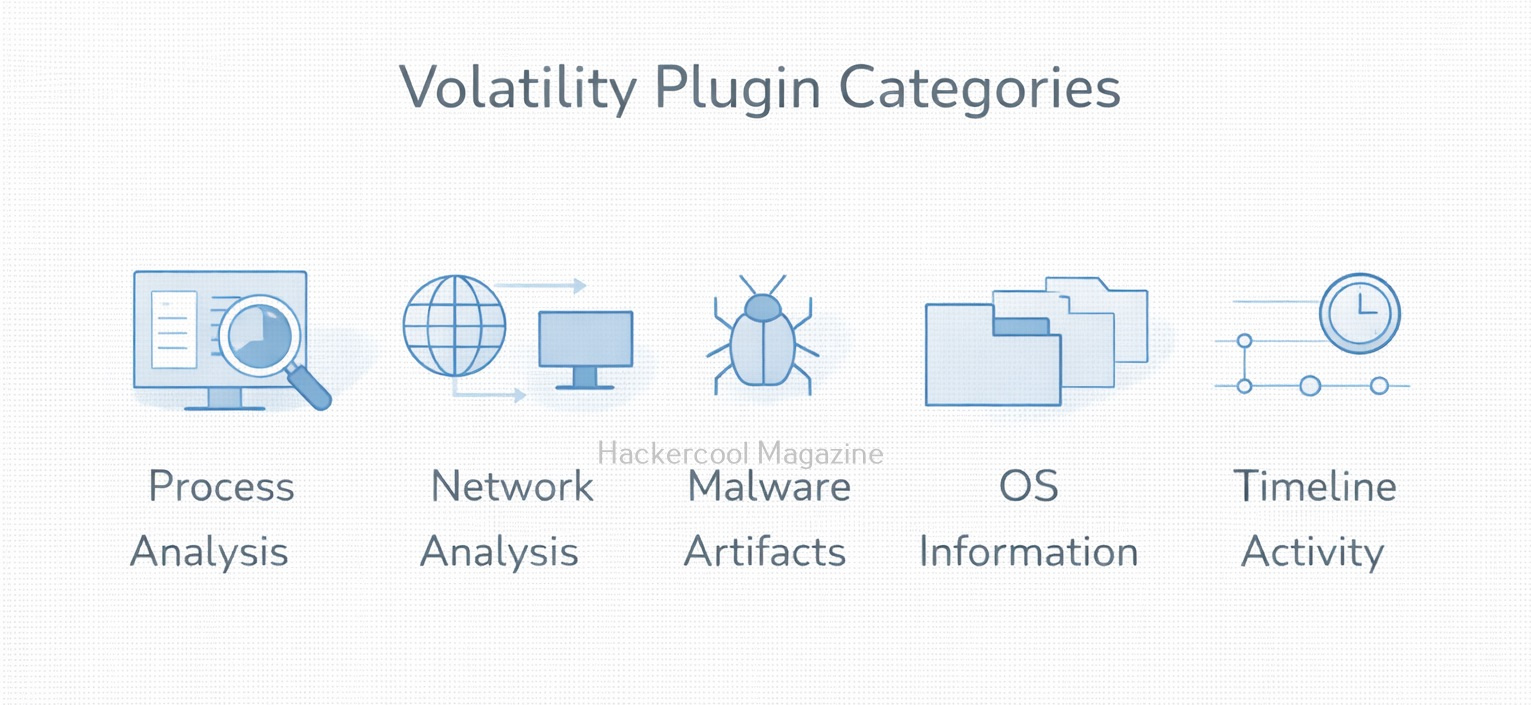
Common Tools Used In Memory Forensics
One of the most widely used tools for memory analysis is Volatility Framework. It allows investigators to extract structured information from memory dumps, such as process lists, network connections and injected code. Other tools and frameworks exist, but beginners should focus on learning:
- How memory dumps are captured
- How analysis tools interpret operating system structures
- How to correlate memory findings with logs and disk evidence
The goal is to understand concepts, not memorize commands.
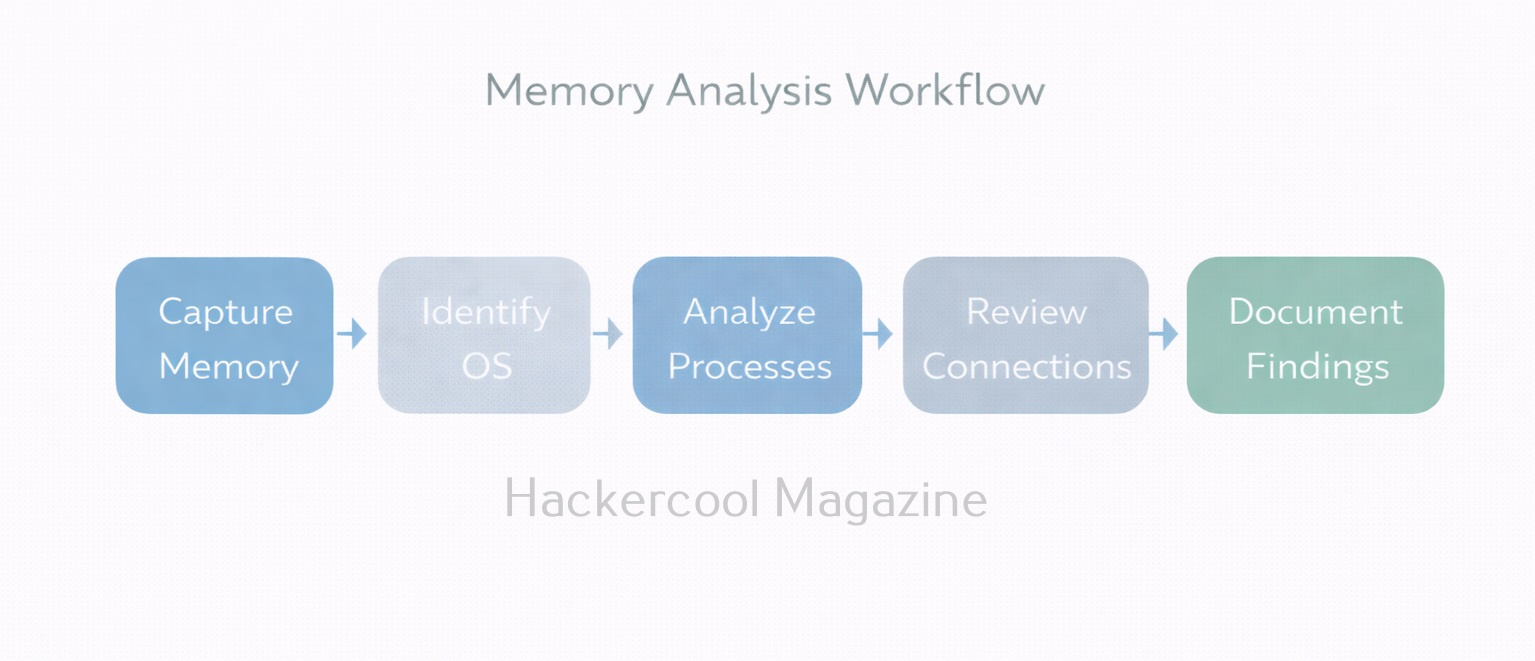
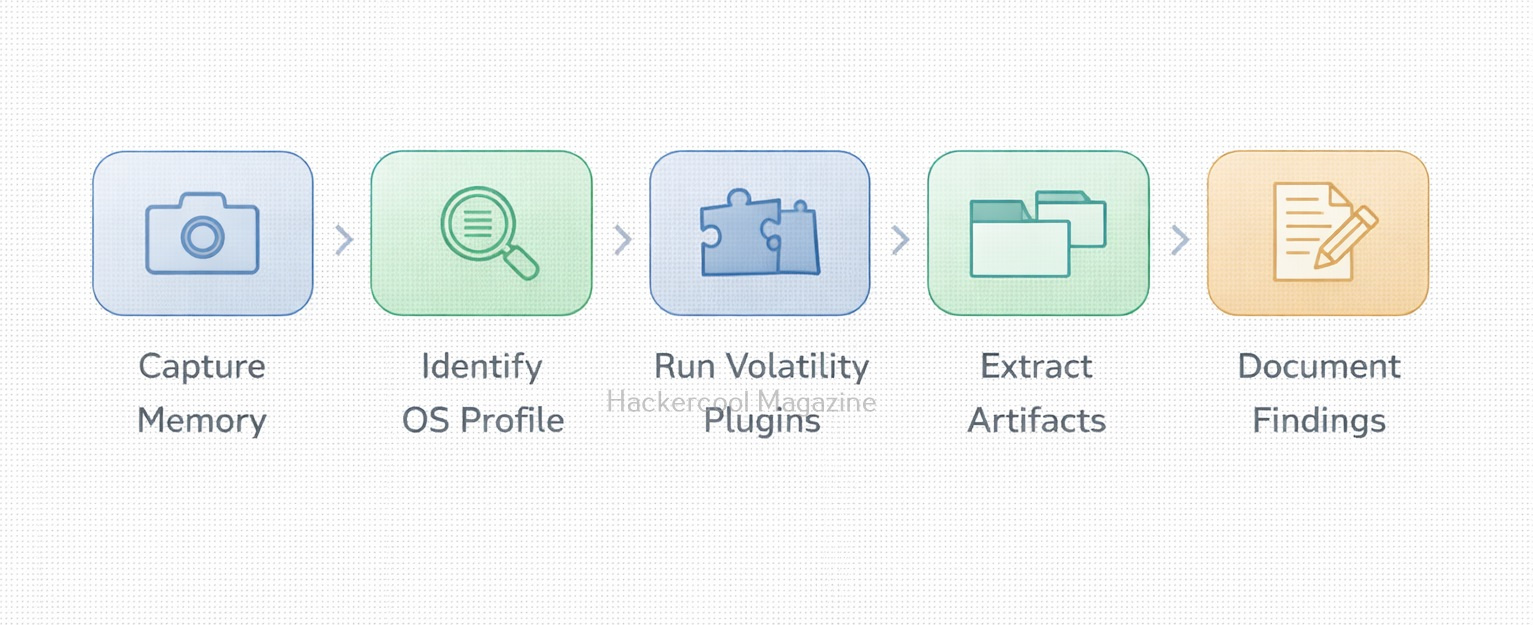
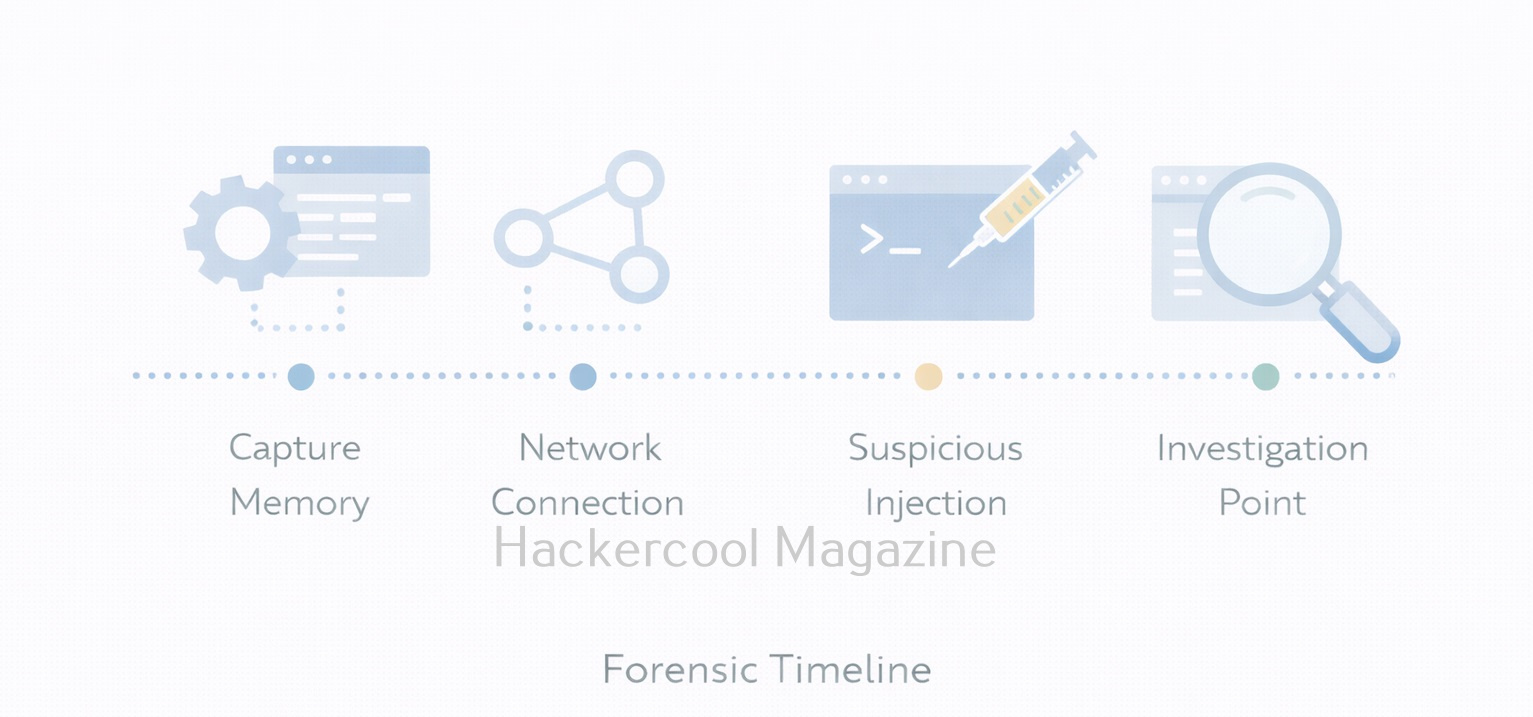
Typical Memory Forensics Workflow
A simplified beginner workflow of memory analysis looks like this:
- Capture memory from a live system (before shutdown if possible)
- Identify the operating system and profile
- Analyze running processes
- Review network connections and handles
- Look for anomalies (hidden processes, unusual parent-child relationships)
- Document findings and correlate with other evidence
Each step builds context rather than relying on a single indicator.
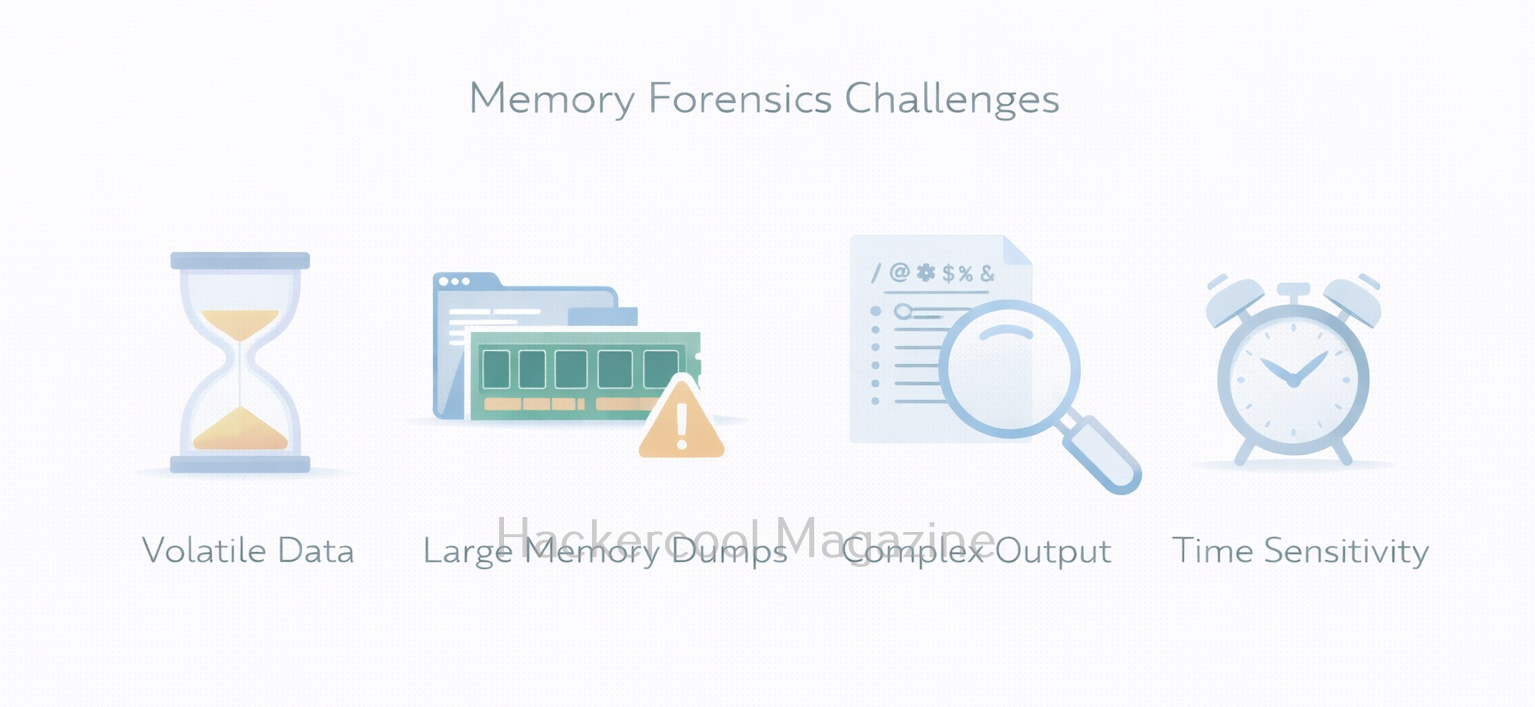
Challenges in Memory Forensics
This forensics comes with some real challenges. They are,
- Volatility of data: Once the system shuts down, RAM is gone
- Large data size: Memory dumps can be several gigabytes
- Complex output: Tools return technical results that require interpretation
- False positives: Not every unusual artifact is malicious
These challenges are normal. Beginners should focus on patterns and behavior, not perfection.
Best Practices for Beginners
If you’re new to memory forensics, you should always keep these principles in mind:
- Capture memory early during incidents
- Preserve original dumps and work on copies
- Correlate memory findings with logs and disk evidence
- Document assumptions and limitations
- Practice using labs, not real systems
Remember that this is a skill built through repetition and observation.
Conclusion
As attacks increasingly target identity, credentials and live processes, memory forensics has become a core DFIR skill. It is especially important in:
- Incident response
- Malware analysis
- Threat hunting
- Advanced investigations
For beginners, learning memory forensics also builds stronger understanding of operating systems and process behavior, which benefits both red and blue team roles. It teaches investigators to look beyond files and focus on live system behavior. While it may seem complex at first, the fundamentals are straightforward: capture memory, analyze activity and reconstruct what happened. In a world of fileless attacks and in-memory threats, memory forensics is no longer optional. it is an essential part of modern digital investigations.
Start Your Ethical Hacking Journey Today
Learning cybersecurity can feel overwhelming at first. The best way to start is with a clear roadmap and the right resources.
Download The Beginner Ethical Hacker Starter Kit (2026 Edition) and get instant access to:
✔ Ethical hacking fundamentals
✔ A beginner cybersecurity learning roadmap
✔ Essential hacking tools every beginner should know
✔ Common vulnerabilities explained simply